
In today’s data-driven world, businesses generate massive volumes of data every second. Traditional data warehouses often struggle to keep up with the scalability, speed, and flexibility modern analytics demand. Enter Snowflake, a revolutionary cloud data warehouse built to overcome these limitations.
What sets Snowflake architecture apart is its unique design that separates storage, compute, and services — allowing organizations to analyze data faster, scale resources seamlessly, and pay only for what they use.
In this guide, we’ll simplify Snowflake’s architecture, walking you step-by-step through its three key layers: Storage, Compute, and Services. By the end, you’ll understand how Snowflake works under the hood and why it’s a preferred choice for businesses worldwide.
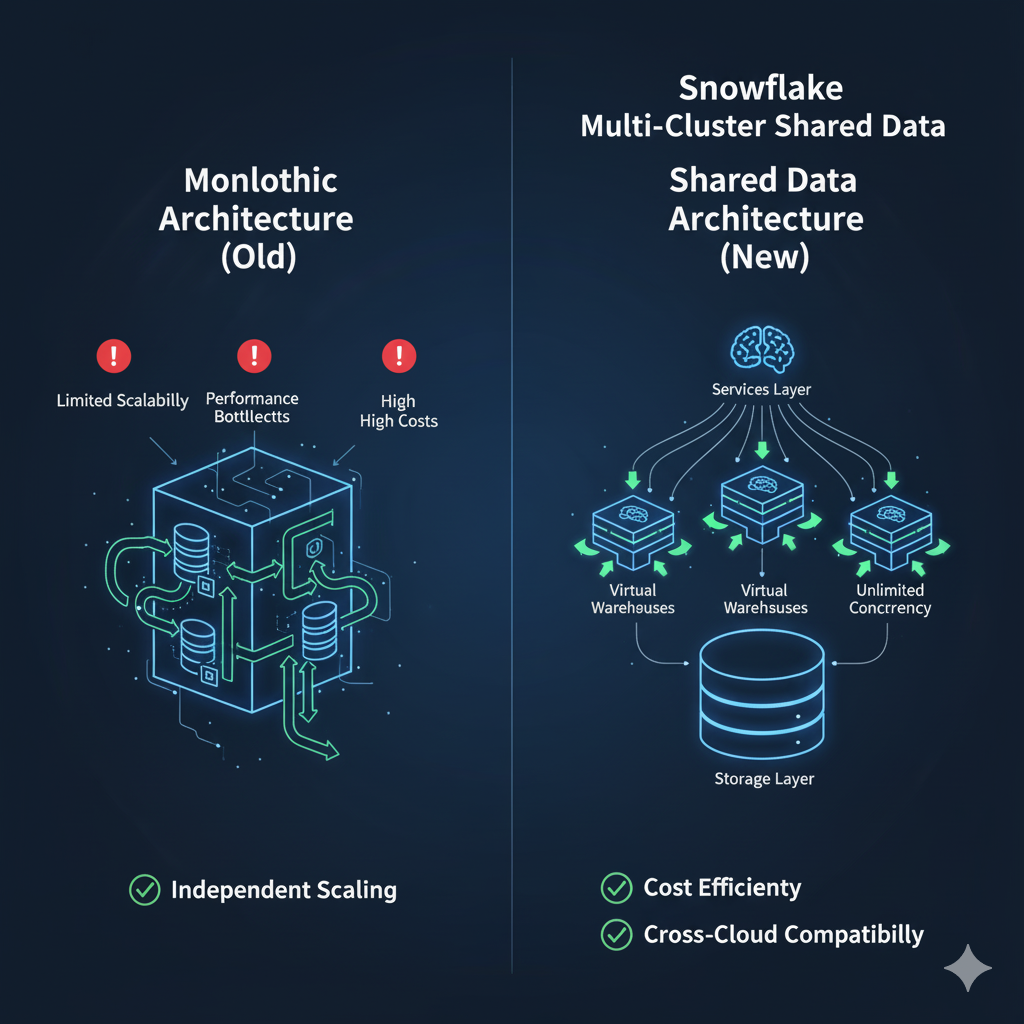
Before Snowflake, most data warehouses followed a monolithic architecture where storage and compute were tightly coupled. This created multiple challenges:
Snowflake solved these problems by introducing a multi-cluster, shared data architecture designed for the cloud.
Think of Snowflake as a high-speed train where the tracks (storage), engines (compute), and control center (services) operate independently but in perfect harmony.
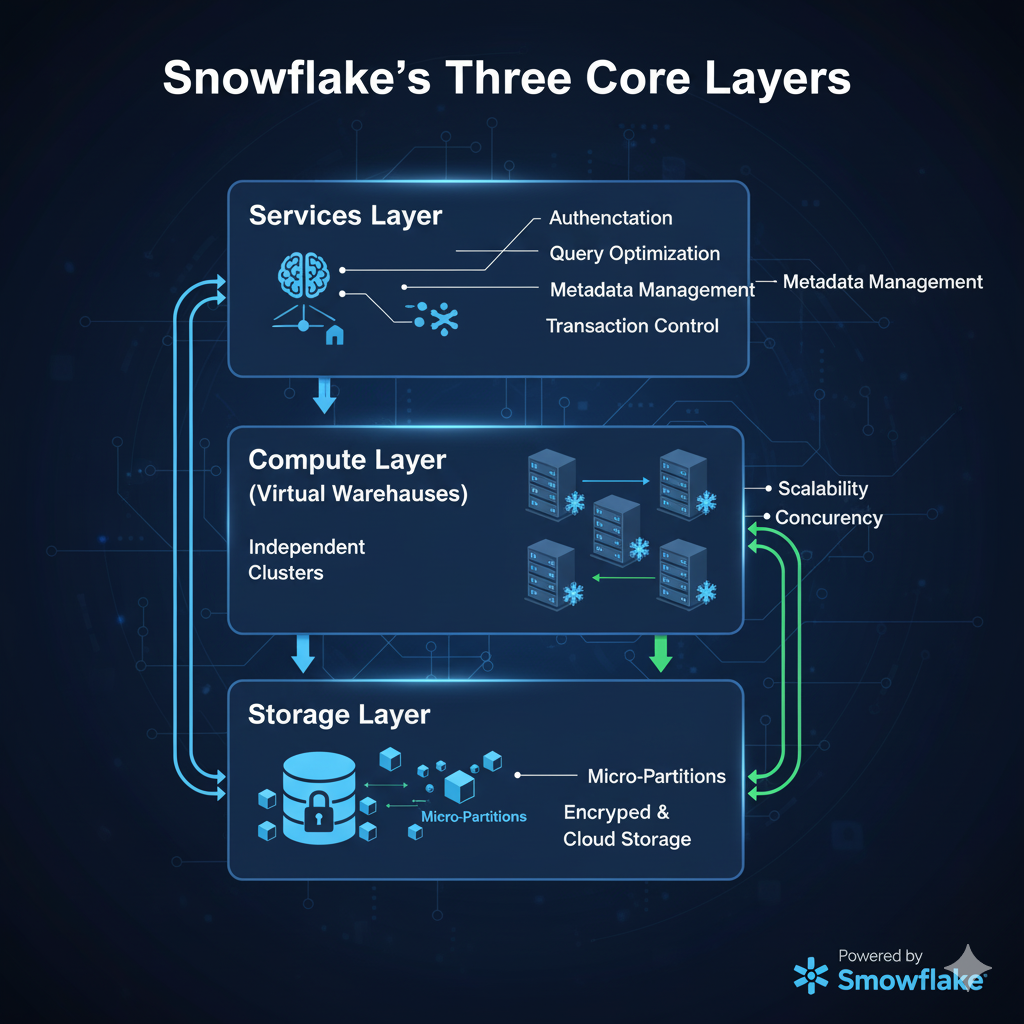
Snowflake is built on three core layers, each serving a specialized purpose but designed to work together efficiently.
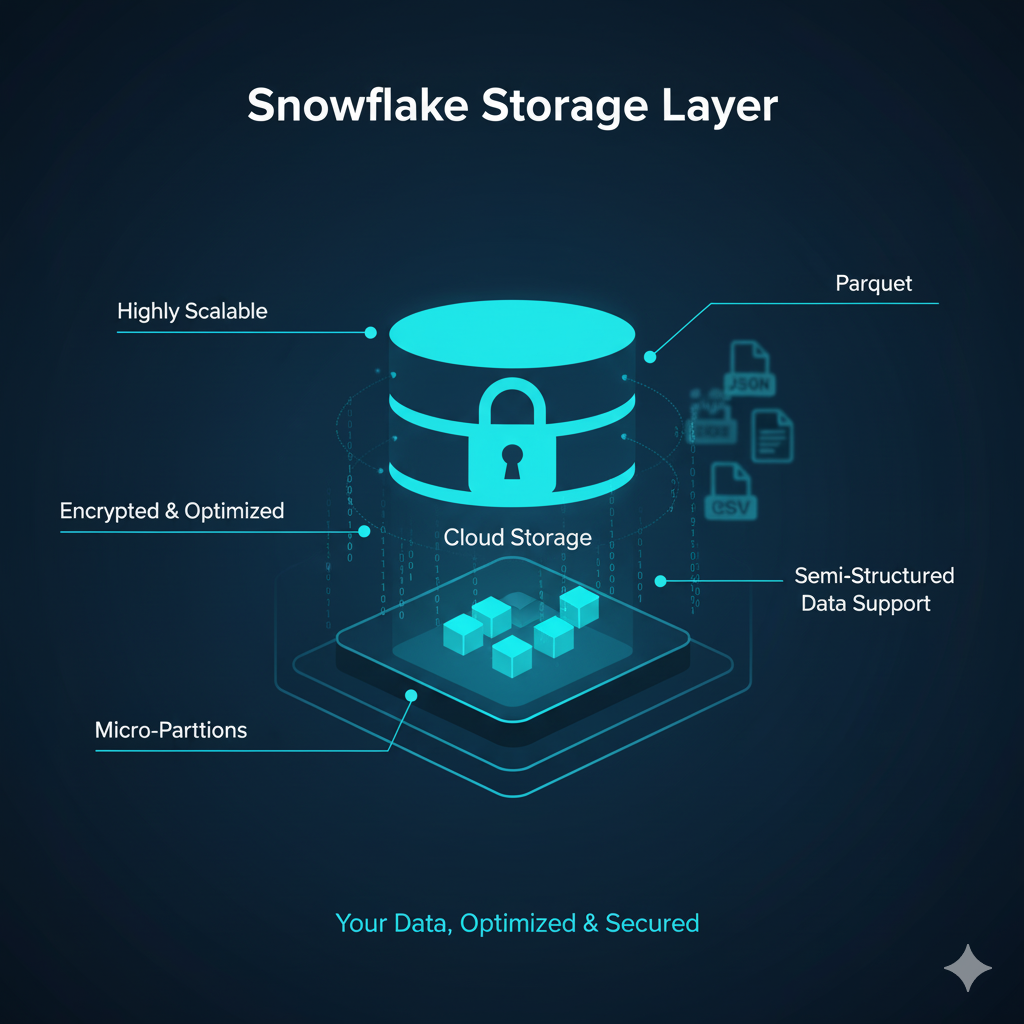
The storage layer is where all your structured and semi-structured data (like JSON, Parquet, and Avro) lives.
Snowflake automatically organizes data into compressed micro-partitions, making it faster to access and cheaper to store.
How it works:
Benefits of the storage layer:
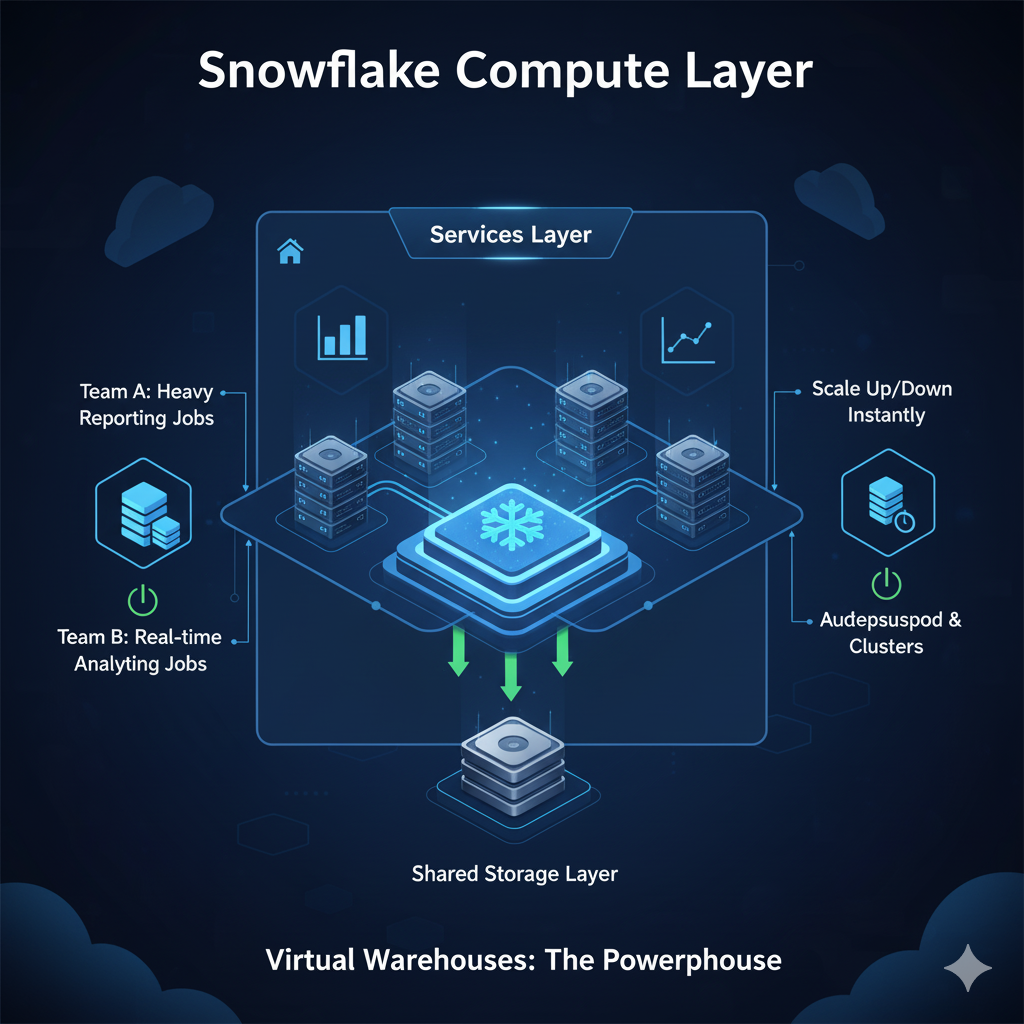
The compute layer is powered by Virtual Warehouses, which are independent clusters of compute resources used for running queries and processing data.
Key features of Virtual Warehouses:
Example Use Case:
Imagine a retail company:
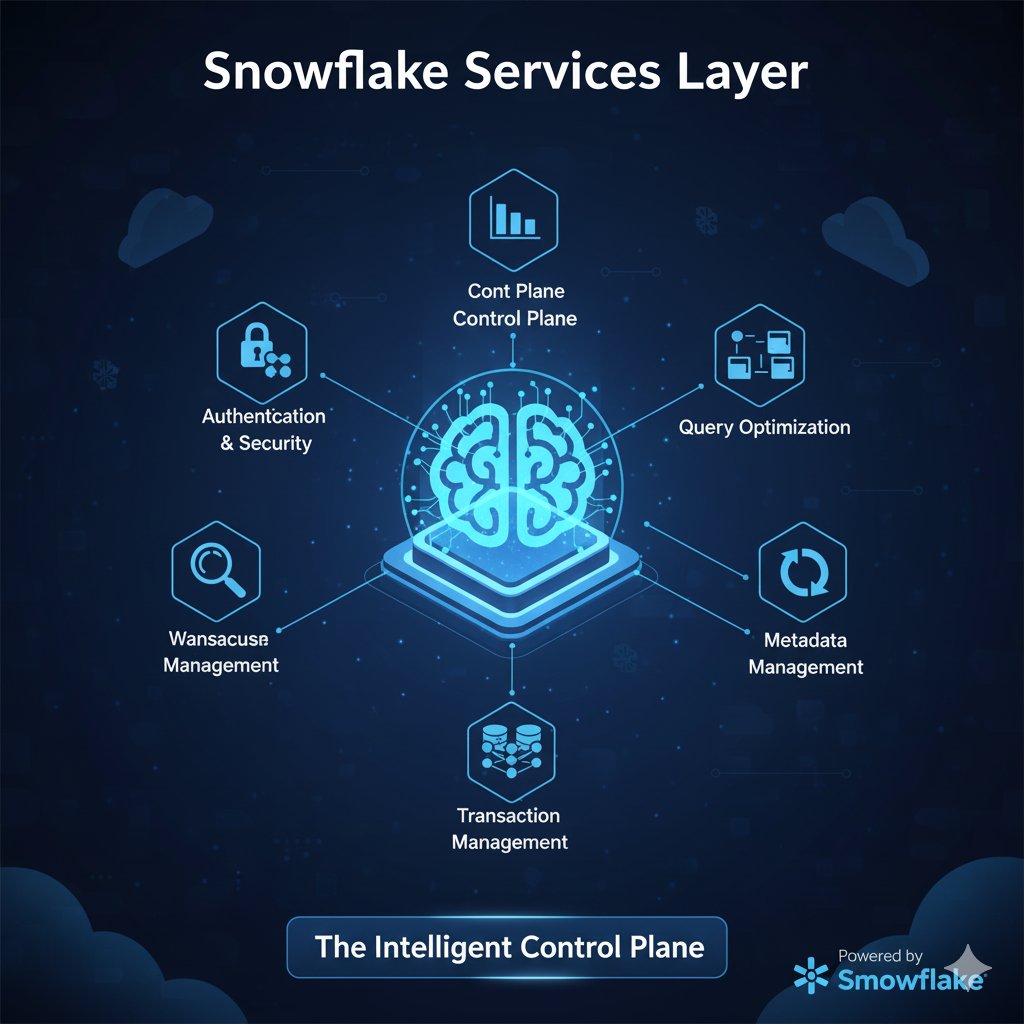
The services layer is like Snowflake’s brain, coordinating and optimizing everything happening across storage and compute.
Core responsibilities include:
Think of the services layer as an air traffic controller — ensuring smooth and safe operations between all the moving parts.
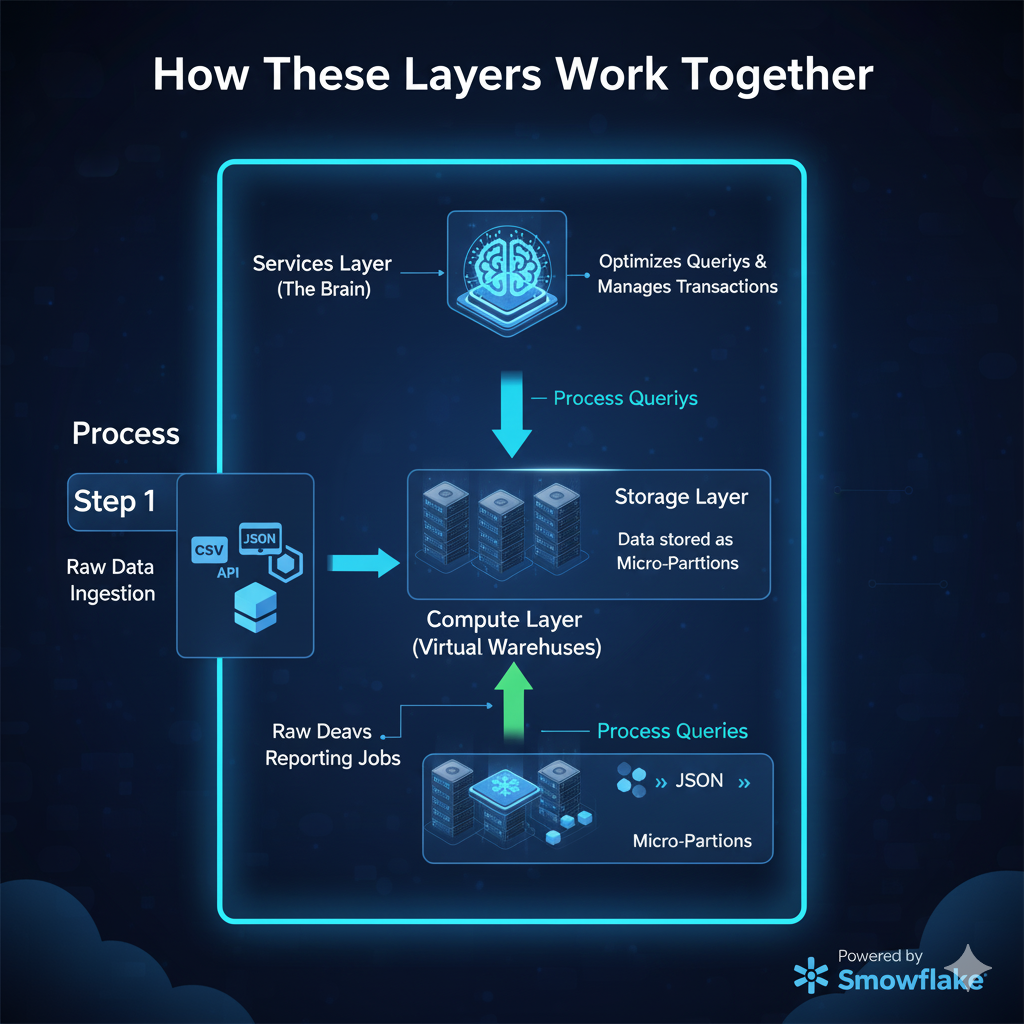
Here’s a step-by-step example of how data flows through Snowflake’s architecture:
| Step | Process | Snowflake Layer |
|---|---|---|
| 1 | Raw data is ingested from external sources (e.g., CSV, JSON, APIs). | Storage |
| 2 | Data is securely stored in micro-partitions. | Storage |
| 3 | A Virtual Warehouse spins up to process queries. | Compute |
| 4 | Services layer optimizes queries and manages transactions. | Services |
| 5 | Users get real-time analytics results. | Output |
This clear separation of responsibilities enables Snowflake to deliver unmatched speed, scalability, and reliability.
A global retail chain uses Snowflake to handle billions of daily transactions.
Result:
| Advantage | How Snowflake Delivers It |
|---|---|
| Scalability | Independently scale compute and storage as needed. |
| Performance | Query optimization and result caching. |
| Concurrency | Multiple teams query data simultaneously without conflicts. |
| Cost Optimization | Pay only for resources used, with auto-suspend features. |
| Cross-Cloud Flexibility | Works seamlessly on AWS, Azure, and GCP. |
Snowflake’s innovative architecture — with its separation of storage, compute, and services — has redefined what’s possible in modern data warehousing. By embracing this cloud-native model, businesses can achieve unlimited scalability, high performance, and cost efficiency like never before.
Whether you’re just starting your Snowflake journey or looking to optimize your existing setup, understanding the architecture is your first step toward data-driven success.
1. How does Snowflake separate storage and compute?
Snowflake uses independent layers for storage and compute. Data stays in the storage layer, while compute resources (Virtual Warehouses) process queries. This ensures performance and scalability without interference.
2. Is Snowflake a cloud data warehouse?
Yes, Snowflake is a fully managed cloud-native data warehouse that runs on AWS, Azure, and Google Cloud.
3. Can Snowflake handle both structured and semi-structured data?
Absolutely. Snowflake supports structured data like tables and semi-structured formats such as JSON, Avro, ORC, and Parquet.

Have you ever feared that artificial intelligence will soon make your job obsolete? The narrative is everywhere—on our screens, in our news feeds, and echoing through our conversations. A profound anxiety has taken hold, whispering that machines are coming to render us irrelevant. But what if this fear is only one side of the story? What if there’s a different narrative, one so extraordinary it will redefine what it means to be human?
Let’s step away from the panic for a moment and consider a different scenario.
Imagine a Master Chef.
His work is an art form: crafting delectable flavors, inventing new recipes, and plating each dish with artistic flair. Yet, his job is also filled with monotonous tasks—the tireless chopping of vegetables, kneading of dough, and stirring of sauces for hours on end.
Now, what if this Chef had a Robot Assistant? This assistant would perfectly execute all the tedious work: dicing vegetables with precision and kneading the dough to the exact consistency every time.
Would the Chef’s career be over? On the contrary! The Chef’s role would become even more critical. Freed from the drudgery, he could devote his time to pure creativity and imagination, crafting culinary masterpieces he never had the time to conceive before. The robot didn’t steal his job; it unlocked his true potential.
This is the essence of AI’s promise for humanity.
The fear of job displacement is not unfounded. AI excels at automating tasks that are repetitive, predictable, and data-driven. The truth is, AI is a relentless force reshaping our professional landscape.
For those whose careers are built on these mechanical tasks, this is a daunting transition. But this is only the beginning of the story.
The true AI revolution—the one that will bring prosperity beyond our wildest dreams—is not a guarantee. It is a prize that we must collectively earn. The AI we are building can be likened to a magical tome that can answer any question and even write new stories of its own. But the wisdom it contains depends on who writes its pages and how we govern its power.
First, the developers and corporations are the scribes writing this magical book. They have the profound responsibility to build it with ethical values and fairness. If they train the AI on data filled with historical biases, the AI will learn and perpetuate those prejudices. They must be held accountable for the systems they create, ensuring that AI-driven decisions are transparent and just.
Second, our governments and societies must act as guardians of this tome. They need to establish strict regulations and laws to ensure this power isn’t misused. We must decide who gets to access this incredible tool and for what purpose. Should it be used to build autonomous weapons or to serve society? Our laws must reflect our values.
Finally, this powerful magic must not be monopolized by a single kingdom. If one country dominates the development of AI, it could gain an unprecedented advantage, creating instability in the world. Global collaboration is essential to ensure AI benefits all of humanity, not just a privileged few.
If we fulfill these conditions, the AI revolution won’t be a nightmare of joblessness. It will be an unprecedented leap forward, freeing us to pursue what truly matters.
The true narrative of AI is not one of a rival, but of a partner. The fear that AI will leave us “starving” is a misunderstanding. The truth is that AI will take care of our mundane, laborious tasks, allowing us to rise to our full potential.
The future belongs to those who learn to use AI as a “Chef’s Assistant.” It’s not about being a master coder, but a master of human skills like critical thinking, empathy, and creativity.
The future of AI isn’t predetermined. Its impact depends entirely on our collective wisdom and responsibility. If we rise to the challenge, we won’t be replaced; we will be empowered to reach new heights, solving the greatest mysteries of our time and building a world more magnificent than we could ever imagine.

We’ve all been there. You inherit a single SQL query that spans 500 lines, looks like a tangled bowl of noodles, and takes five minutes to run. Your task? Just add one more column. It’s a nightmare.
Getting the right answer from the database is only half the battle. A truly great data professional writes queries that are not just correct, but also clean, fast, and understandable. This isn’t just about being tidy; it’s about saving yourself (and your teammates) hours of future frustration.
Let’s dive into the core habits that will transform your SQL from a messy script into a masterpiece of logic and efficiency.
The fastest way to improve your queries is to make them readable. A well-formatted query reveals its logic at a glance.
Why it matters: When you revisit your code six months from now, you’ll thank yourself. When a colleague needs to debug your work, they’ll thank you too.
Here are some simple rules to live by:
UPPERCASE for SQL keywords like SELECT, FROM, JOIN, and WHERE. Use lowercase for your table and column names.JOIN gets its own line. The WHERE, GROUP BY, and ORDER BY clauses are all indented at the same level.SELECT statement, list each column on its own line. This makes it easy to see what fields are being pulled and simplifies adding or removing columns later.Before:
SQL
select u.id,u.name,p.order_date from users as u join purchases as p on u.id=p.user_id where u.signup_date > '2025-01-01' and p.amount > 1000;
After:
SQL
SELECT
    u.id,
    u.name,
    p.order_date
FROM
    users AS u
JOIN
    purchases AS p
    ON u.id = p.user_id
WHERE
    u.signup_date > '2025-01-01'
    AND p.amount > 1000; -- Assuming amount is in INR
The difference is night and day. The second query tells a clear story.
As your logic grows, it’s easy to fall into “subquery hell”—a confusing maze of nested SELECT statements. The hero that saves us from this is the Common Table Expression (CTE).
Think of CTEs as named, temporary tables that exist only for a single query. You define them at the beginning using a WITH clause. This allows you to break a complex problem into simple, logical steps.
Before: Subquery Hell
SQL
SELECT
    avg(orders_per_user)
FROM (
    SELECT
        user_id,
        count(order_id) AS orders_per_user
    FROM
        orders
    WHERE
        order_date BETWEEN '2025-07-01' AND '2025-07-31'
    GROUP BY
        user_id
) AS monthly_orders;
After: Clean and Logical with a CTE
SQL
WITH monthly_orders AS (
    SELECT
        user_id,
        count(order_id) AS orders_per_user
    FROM
        orders
    WHERE
        order_date BETWEEN '2025-07-01' AND '2025-07-31'
    GROUP BY
        user_id
)

SELECT
    avg(orders_per_user)
FROM
    monthly_orders;
The CTE version reads like a story: “First, create a temporary table of monthly orders, then find the average from that table.”
A quick note on aliasing: Always give your tables short, logical aliases (e.g., users AS u). This keeps your query tidy and easy to read, especially when joining multiple tables.
A clean query is great, but a fast query is even better. Performance tuning can seem like a dark art, but two concepts will solve 80% of your performance problems: indexes and explain plans.
An index is a special lookup table that the database search engine can use to speed up data retrieval.
Analogy: Imagine trying to find a topic in a book without an index page. You’d have to scan every single page. An index lets you jump directly to the right page. That’s exactly what a database index does for your data.
Rule of Thumb: If you frequently filter (WHERE clause) or join (ON clause) on a specific column, it’s a prime candidate for an index. For example, user_id, email, or transaction_date are columns that almost always benefit from being indexed.
EXPLAIN PlanHow do you know if your query is using an index? You ask the database!
The EXPLAIN command (or EXPLAIN ANALYZE in PostgreSQL) is your window into the database’s mind. It shows you the execution plan—the step-by-step process the database will use to run your query.
When you run EXPLAIN on your query, look for one major red flag: a Full Table Scan. This means the database is reading every single row in a table, just like reading a book page-by-page. If you see this on a large table (millions of rows), it’s a sign that you are likely missing an index on the column in your WHERE clause.
Writing great SQL is a craft that develops with practice. By focusing on clean formatting, simplifying logic with CTEs, and boosting performance with indexes and EXPLAIN plans, you’re doing more than just getting the right answer.
You’re building systems that are robust, maintainable, and efficient. You’re becoming the data professional that everyone wants on their team.
If you’re learning SQL joins, chances are you’ve already seen INNER JOIN, LEFT JOIN, and RIGHT JOIN. But there’s one more join type that often confuses beginners — FULL OUTER JOIN.
Let’s break it down in simple terms.
A FULL OUTER JOIN returns all records from both tables, whether or not there is a match.
NULLs for B’s columns).NULLs for A’s columns).Think of it as a combination of:
LEFT OUTER JOINRIGHT OUTER JOINSELECT *
FROM TableA
FULL OUTER JOIN TableB
ON TableA.id = TableB.id;
TableA     TableB
  ●───────●
 ┌──────────────┐
 │ A ⋈ B (both) │  ← Matching rows
 │     A only   │  ← Left-only rows (nulls from B)
 │     B only   │  ← Right-only rows (nulls from A)
 └──────────────┘
While FULL OUTER JOIN wasn’t deeply demoed in lectures, the concept was covered in summaries and diagrams. The instructor mentioned:
“If needed later, we’ll revisit it with examples where FULL OUTER JOIN is best used.”
So keep the idea clear:
FULL OUTER JOIN = Everything from both sides, matched or not.

These days, on every street corner and in every online forum, you’ll hear the same advice: “Dude, buy Bitcoin! It’s the future!” But what’s the story behind the scenes? How is this digital money actually created? Are people really just printing money on their computers?
Let’s break down the agriculture of this digital world, process by process. Forget the complicated technical jargon; imagine we’re in a digital village, and our job is to “grow” money.
Every cryptocurrency is grown on a piece of “land” we call the Blockchain. But this isn’t ordinary land; it’s a magical, shared field.
Imagine a village where every single house has a copy of the same public ledger (bahi-khata). Whenever a transaction happens in the village, an entry is made in every single household’s ledger, all at the same time.
Just as a farmer works hard in the fields to grow a crop, new coins are “mined” on the blockchain through hard work.
When a “page” in the ledger (called a Block) gets filled with transactions, that page needs to be sealed and added to the book. But this isn’t an easy task.
To seal the page, the system creates a very difficult and unique mathematical puzzle (a cryptographic puzzle).
Thousands of “overseers” (miners) from around the world use their powerful computers to try and solve this puzzle. The first miner to solve it gets a reward.
And what’s the reward? Brand new, freshly created coins!
This is the “digital money printing” you’ve heard about. But instead of a printing press, it requires immense computing power and ingenuity.
This isn’t your high school math problem. It’s a puzzle with no direct formula. There’s only one way to solve it: Keep trying until you find the right answer (Brute-Force).
Think of it like this:
The computer that finds the right key first wins. It gets to “lock” the block, making it a permanent part of the chain. This process is made incredibly difficult on purpose to prevent anyone from cheating the system.
When a miner wins the race to solve the puzzle, they get the fruits of their labor. This reward comes in two forms:
A Special Rule (The Halving): In currencies like Bitcoin, there’s another rule. Every four years, the reward for creating new coins is cut in half. This is called the Halving. It ensures that the supply of new coins is controlled and limited, which can help increase their value over time.
This isn’t just a scheme to make money. Its real purpose is to change the world of finance:
All crypto coins are not created the same way.
No! Absolutely not.
It is a high-tech way to earn money, but it requires serious effort, investment, and knowledge. Mining requires expensive computers and consumes a massive amount of electricity.
So, the next time someone tells you to “get into crypto,” don’t just see it as an investment. See it for what it is: the world’s most transparent, technology-driven financial system. It’s not a shortcut; it’s a blueprint for the future.
The modern business world is awash in data, yet many organizations struggle to rapidly transform this data into actionable insights. Traditional Business Intelligence (BI) tools, powerful in their time, often create bottlenecks, limiting data access to only a select few technical users and relying on stale information. This post will articulate how Sigma Computing is fundamentally changing this game, introducing a “Next Gen BI” approach that directly addresses the shortcomings of established players like Microsoft Power BI and Tableau. We’ll delve into Sigma’s unique strengths and compare it directly against its competitors, highlighting why it’s a superior choice for today’s cloud-first enterprises seeking true data democratization and operational agility.
Sigma Computing is a cloud-native analytics and business intelligence platform designed from the ground up for the modern data stack. It connects directly to Cloud Data Warehouses (CDWs) like Snowflake, Databricks, Google BigQuery, and Amazon Redshift. This direct connection eliminates the need for data extracts or manual imports, ensuring users consistently work with live, real-time, and up-to-date information.
Traditional BI tools like Power BI and Tableau often rely on data extracts or import modes for performance. Extracted data are static copies, inherently creating several problems: stale data (decisions based on outdated information), data duplication (multiple versions of the truth, increasing storage costs), and potential security vulnerabilities (data resides outside the governed warehouse). Sigma’s direct live connection to the CDW inherently bypasses these issues. This isn’t just a feature difference; it’s a fundamental architectural advantage that directly translates into the “elimination of data debt.” By ensuring a single, live source of truth, Sigma fosters data integrity and trust across the organization, reducing the time spent resolving discrepancies and improving decision-making speed and accuracy. This proactive approach to data quality and freshness is a strategic asset in today’s data-intensive environments.
Sigma’s architecture is built to leverage the immense computational power of the underlying cloud data warehouse, enabling it to efficiently handle large datasets—even billions of rows—without performance degradation or crashes. It optimizes for speed using an intelligent query engine that connects directly to the CDW and aggregates results without recalculating by utilizing data warehouse query caching, further enhancing speed and warehouse load.
A cornerstone of Sigma’s design is its instantly familiar “Excel-style” spreadsheet user interface (UI). This design choice dramatically reduces the learning curve for business users, empowering them to independently explore, analyze, and visualize data without the need for advanced SQL skills or specialized BI training. Users can perform complex operations like pivot tables, conditional formatting, and calculated columns within an environment they already understand.
Many BI tools claim “democratization,” but deep, ad-hoc data exploration often remains the domain of technical users. This is because advanced analysis typically requires mastering proprietary languages (like DAX) or writing complex SQL. Sigma’s spreadsheet UI means the same familiar interface used for basic viewing can be used for sophisticated analysis. This isn’t just about ease of use for one person; it’s about fundamentally raising data literacy across the entire organization. By removing the technical barrier, Sigma enables a much broader audience—from finance to marketing to operations—to move from passive data consumption to active, self-service data exploration and insight creation. This reduces reliance and backlog on central IT or data expert teams for ad-hoc requests, accelerating the overall “data-to-insight” time.
Sigma fosters advanced collaboration, allowing multiple users to work concurrently on shared dashboards and reports in real-time, promoting a more cohesive and data-driven culture within organizations. This real-time interaction improves alignment across departments.
A unique and distinguishing feature of Sigma is its native “write-back” capability, enabled through “Input Tables.” This allows users to directly input changes, adjust forecasts, run “what-if” analyses, or flag exceptions directly from within the Sigma interface, with these modifications securely written back to governed tables in the cloud data warehouse.
Traditional BI tools are primarily designed for descriptive and diagnostic analysis (“what happened” and “why it happened”). Insights are generated, but acting on them often requires exporting data, manual processes, or integrating with separate operational systems. This creates a disconnect between analysis and execution. Sigma’s native write-back capability fundamentally transforms BI from a reporting tool into an operational platform. This capability enables organizations to move beyond simply understanding data to directly acting on it within the analytical environment. This enables the creation of “data apps” that automate workflows, allowing for real-time adjustments to business processes based on live information. This is a significant shift towards prescriptive and operational analytics, where BI becomes an integral part of business workflows, accelerating decision execution and driving tangible business outcomes.
Sigma integrates “agentic AI” with features like “Ask Sigma,” allowing users to accelerate data analysis using natural language queries. A key differentiator of Ask Sigma is its commitment to transparency: it “shows its work,” providing editable steps and traceable logic for its conclusions. This approach builds trust in AI-powered insights. Furthermore, this AI functionality can be directly embedded into a customer’s product, allowing end-users to gain self-service insights and ask natural language questions without relying on dedicated analysts or leaving their application.
While AI capabilities are becoming increasingly common in BI tools (Power BI Copilot, Tableau Pulse/Explain Data), a significant barrier to widespread AI adoption in business is a lack of trust due to the “black box” nature of some AI outputs. Users may hesitate to act on insights if they don’t understand how the AI arrived at its conclusion. Sigma’s explicit emphasis on “showing its work” and providing traceable logic directly addresses this fundamental concern. This transparency transforms AI from a mysterious oracle into a transparent, collaborative assistant. By allowing users to inspect and understand the steps taken by the AI, Sigma builds trust, facilitates deeper learning, and empowers users to validate and iterate on AI-generated insights. This is crucial for broader, confident adoption of AI in critical business decision-making processes, especially in regulated or high-stakes environments.
Sigma is architecturally designed to handle large datasets, efficiently leveraging the power of the underlying cloud data warehouse. It optimizes for speed by connecting directly to the CDW and using a proprietary in-browser intelligent query engine.
Sigma reuses queries when multiple workbook pages or elements rely on the same data, reducing latency. It also utilizes multiple levels of caching, including leveraging Snowflake’s result cache and performing some calculations directly in the user’s browser. These mechanisms significantly reduce warehouse load and provide a fast user experience, even with complex queries against billions of rows.
Cloud data warehouses offer tremendous scalability, but their “per-query” or “compute-based” pricing models, if not managed efficiently, can lead to rapidly escalating costs, especially with high user concurrency and complex queries. Sigma’s intelligent query engine, query caching (leveraging in-browser and CDW caches like Snowflake), and query reuse capabilities are not just about raw speed. These features represent a sophisticated cost-management strategy. By minimizing unnecessary queries and optimizing the compute resources utilized in the data warehouse, Sigma aims to reduce the “cost per user” as the number of users and queries grows across the organization. This is a critical differentiator for large enterprises, as it helps them maximize their existing cloud data infrastructure ROI and provides a more predictable and cost-effective path to widespread data consumption.
Microsoft Power BI is a comprehensive business analytics platform, deeply integrated within the broader Microsoft ecosystem, including Microsoft Fabric and Azure. It offers robust data visualization capabilities, allowing users to transform raw data into rich, interactive charts, graphs, and reports.
Its strengths include powerful data analysis features, extensive data modeling capabilities using DAX (Data Analysis Expressions), and a robust Power Query Editor for data transformation (cleaning, reshaping, merging, and filtering data from various sources). The Power BI Service facilitates collaboration through content packs, shared workspaces, and data-driven alerts. The recent introduction of Power BI Copilot enhances analysis with AI-powered insights, natural language processing, and automated report generation.
Limitations: Power BI can present a steep learning curve, especially for mastering DAX for advanced calculations. While it supports DirectQuery for live data, it often performs best when data is imported into its own engine (Import Mode), which can lead to stale data if not refreshed frequently. It lacks native version control, often relying on external solutions like SharePoint. Performance can degrade with very large datasets, especially if not properly optimized or if transformations are pushed downstream. Real-time collaboration for report editing is also limited.
Tableau is widely recognized for its powerful data visualization capabilities and its ability to create stunning, interactive dashboards. It offers extensive customization options, making it a gold standard for visual storytelling and pixel-perfect design.
The platform features an intuitive drag-and-drop interface for building reports and connects to a wide range of data sources, including both cloud and on-premises systems. Tableau supports data blending from multiple sources and offers robust capabilities for advanced calculations through calculated fields and Level of Detail (LOD) expressions. Tableau’s AI capabilities include “Explain Data” which automatically identifies why a data point is significant, “Ask Data” for natural language queries, and “Tableau Pulse” to deliver proactive, personalized insights directly to business users. These are built on the Einstein Trust Layer, emphasizing data security and privacy.
Limitations: Despite its cloud offerings, Tableau’s fundamental architecture often heavily relies on “data extracts” (using its Hyper engine) for performance, even when connecting to cloud data warehouses. This can lead to data latency, duplication, and increased storage/compute costs. It lacks native write-back functionality and native version control (though Tableau Server/Cloud offer history tracking). Extensive data preparation often requires a separate tool, Tableau Prep Builder, which can incur additional costs and limitations on scheduling live connections. Its pricing model can also be complex with various add-ons.
Here’s a table comparing the key differentiators between Sigma, Power BI, and Tableau:
| Category | Sigma | Power BI | Tableau |
| Data Architecture / Connectivity | Live Query (Cloud-Native, Direct CDW Connection, No Extracts) | Import Mode (Extract) and DirectQuery | Extracts (Hyper) and Live Connections |
| User Interface / Accessibility | Spreadsheet-like UI (Intuitive for Business Users, No Code Needed) | Microsoft Office-like UI (DAX for advanced calcs, steeper learning curve) | Drag-and-Drop (Visual focus, some technical knowledge for complex builds) |
| Collaboration & Functionality | Real-time multi-user editing, Native Write-back (Input Tables), Data Apps | Workspaces, Content Packs, Data-driven Alerts (Limited real-time edit collab) | Server/Cloud sharing (No native write-back, limited co-authoring features) |
| AI Capabilities | Ask Sigma (Agentic AI, Natural Language, Shows work/traceable logic) | Copilot (Natural Language, AI-powered insights, automated reports) | Explain Data, Ask Data, Pulse (AI-powered explanations, NL, proactive insights) |
| Data Governance & Version Control | Warehouse-first permissions, Native Git-like version control, Audit Logging, Data Lineage | Workspace roles, RLS, Deployment Pipelines (Relies on external for versioning) | User roles, Permissions, RLS (Server/Online history tracking, limited native versioning/lineage without add-ons) |
Sigma’s core differentiator lies in its truly cloud-native architecture that directly queries live data from the data warehouse. This “live-first” approach means no data extracts, no manual refreshes, and therefore, no stale data. Every analysis reflects the most current information available, empowering real-time decision-making.
Both Power BI and Tableau, while capable of live connections, often default to or recommend data extracts (or Import Mode in Power BI) for optimal performance, especially with large datasets. This extract-based model, a legacy from their on-premises origins, introduces data latency, potential duplication, and increased storage/compute costs. In today’s dynamic markets, competitive advantage often hinges on the speed and accuracy of decision-making. Relying on data extracts, even with scheduled refreshes, creates a time lag between data generation and its availability for analysis. This lag, however seemingly small, can accumulate and lead to critical business decisions being made based on outdated information, directly impacting business agility and competitiveness. Operational delays and “decision paralysis” can result. Sigma’s “live-first” approach ensures that insights are always based on the most current data. This is not merely a technical feature; it’s a strategic imperative. It enables organizations to react to market changes, customer demands, and internal shifts with unprecedented speed and confidence. It fundamentally transforms team dynamics, shifting the focus from “debating the data to acting on it,” which is crucial for operational alignment and continuous growth.
Sigma’s intuitive spreadsheet-like interface is a game-changer for business users. It allows individuals with basic spreadsheet skills to perform complex data analysis, build pivot tables, and define custom calculations—all without writing SQL or mastering complex proprietary languages like DAX. This reduces reliance on data specialists and accelerates time to insight.
Power BI requires knowledge of DAX for advanced metrics and calculations, which can be a significant barrier for non-technical users. Tableau, while offering a drag-and-drop interface, still requires some technical understanding to build complex visualizations from scratch and often necessitates a separate tool (Tableau Prep Builder) for robust data transformations. Despite the widespread adoption of BI tools, many organizations still face a bottleneck where a small group of data specialists are overwhelmed by ad-hoc requests from business users who lack the technical skills for self-service. This limits the scalability of analysis. Sigma directly addresses this challenge by leveraging the universally familiar spreadsheet paradigm. It doesn’t require users to learn a new “data language,” but rather extends their existing proficiency. This approach enables true “data democratization” by empowering a larger segment of the workforce to directly engage with data. This not only reduces the burden on central data teams for routine analysis but also fosters a more data-literate culture across the entire enterprise. Business users gain the confidence to explore and extract insights on their own, transforming their roles from data consumers to active data participants.
Sigma provides robust real-time, multi-user collaboration on live data, allowing teams to seamlessly work together on shared dashboards and reports. Critically, Sigma uniquely supports native “write-back” capabilities through Input Tables. This means users can directly input changes, adjust forecasts, run “what-if” analyses, or flag exceptions directly from within the Sigma interface, with these modifications securely written back to governed tables in the cloud data warehouse. This enables the creation of custom “Data Apps” that automate workflows and allow end-users to directly act on insights.
Both Power BI and Tableau offer collaboration features for sharing, commenting on, and distributing reports and dashboards. However, they generally lack native, out-of-the-box write-back functionality. This means while insights can be generated, acting on them often requires manual processes, exporting data, or integrating with separate operational systems, creating a disconnect between analysis and execution. Power BI’s real-time collaboration for report editing is also reported to be limited. Historically, BI tools have excelled at descriptive analysis (“what happened”) and diagnostic analysis (“why it happened”). Their primary output is a report or dashboard summarizing past events. For many organizations, the challenge has been bridging the gap between gaining an insight and actually acting on it. This has often involved a manual, multi-step process outside of the BI tool. Sigma’s native write-back and Data App capabilities fundamentally redefine the scope of BI. It transforms the platform from merely a reporting and analysis tool into an operational and prescriptive instrument. This allows businesses to not only understand what happened but also directly influence what should happen and how to do it within the same environment. Examples like real-time budget adjustments or supply chain planning illustrate how Sigma directly enables business process automation and real-time decision execution, making analysis an active, integral part of daily operations rather than a retrospective exercise.
Sigma’s “agentic AI” feature, Ask Sigma, allows users to accelerate data analysis using natural language queries. A significant differentiator is that Ask Sigma “shows its work,” providing editable steps and traceable logic for its conclusions. This transparency builds trust and understanding in AI-powered insights. AI capabilities can also be directly embedded into customer products, enabling self-service analysis for end-users.
Power BI Copilot offers AI-powered insights, natural language processing (NLP), and automated report generation. Tableau’s “Explain Data” provides AI-powered explanations for data points, “Ask Data” enables natural language queries, and “Tableau Pulse” delivers proactive, personalized insights. While powerful, the level of transparency in how these AI tools derive their answers can vary compared to Sigma’s explicit “show its work” approach. Tableau’s AI is built on the Einstein Trust Layer, emphasizing security and privacy. A significant barrier to widespread AI adoption in business is user trust. If the AI’s reasoning is opaque (a “black box”), users may hesitate to rely on its conclusions, especially for critical decisions. Sigma’s “show its work” feature directly addresses this psychological and practical barrier. By making the AI’s analytical steps explicit and editable, users can validate the logic, learn from the process, and even refine the AI’s output. This approach transforms AI from a mysterious, potentially unreliable tool into a transparent, collaborative assistant. This fosters a deeper level of engagement and confidence, which is essential for broad, confident adoption of AI-generated insights across an organization, particularly in industries with high regulatory scrutiny or where data integrity is paramount. It shifts the focus from merely getting an answer to understanding the answer and its derivation.
Sigma’s pricing structure is often highly favorable for large organizations, as it allows for unlimited viewers in some plans, primarily requiring licenses for “creators” (those actively building data models and analyses). This can lead to significantly lower total cost of ownership for widespread data access compared to per-user models for all user types. Furthermore, by directly leveraging the compute of the cloud data warehouse and optimizing queries with intelligent caching and query reuse, Sigma can help manage and even reduce overall warehouse costs as usage grows.
| Tool | Pricing Model | Key Advantage |
| Sigma | Creator licenses required; unlimited viewers often free. Average annual cost ~$60,000 (range $17,500–$132,800). Pricing is often undisclosed and requires direct contact. | Highly cost-effective for large organizations with many data consumers, shifts compute burden to CDW. |
| Power BI | Free Desktop; Pro ($10-$14/user/month); Premium Per User ($20-$24/user/month); Fabric capacity (variable, starting ~$262.80/month for F2). | Free entry point, strong integration with Microsoft ecosystem. |
| Tableau | Creator ($75-$115/user/month); Explorer ($42-$70/user/month); Viewer ($15-$35/user/month). Tableau Public (free, public sharing). | Tiered access for different user roles, strong visualization focus. |
Traditional BI tools often incur significant costs related to their own dedicated infrastructure (servers, storage for extracts) in addition to the costs of the underlying data warehouse. Sigma’s warehouse-native approach shifts the primary compute burden (and thus most of the cost) to the highly optimized, scalable cloud data warehouse that organizations are already heavily investing in. Then, by optimizing queries within that warehouse and offering flexible licensing models, including unlimited viewers, Sigma helps organizations maximize their existing cloud data infrastructure ROI. This strategic cost alignment allows businesses to scale data consumption across the entire enterprise more effectively and predictably, turning data access into a widespread asset without prohibitive per-user costs for every single consumer.
Sigma offers robust security features, including role-based access control (RBAC), ensuring data remains protected and compliant with industry regulations. A crucial aspect is that data never leaves the cloud data warehouse, preventing duplication and unauthorized sharing. Permissions can be inherited directly from the CDW or set granularly within Sigma. Furthermore, Sigma provides native version control (similar to Git), comprehensive query history tracking, and audit logging, offering full transparency and data lineage for every analysis.
Power BI provides strong governance capabilities with workspace roles, deployment pipelines, and robust Row-Level Security (RLS). However, it lacks native version control, often relying on external solutions like SharePoint for managing version history. Tableau also has built-in governance tools and RLS, but its data lineage tracking can be limited without additional paid tools like Tableau Catalog. The reliance on extracts in both tools can also introduce additional security and governance complexities. As organizations increasingly manage large and sensitive datasets, and face stringent regulatory compliance (e.g., GDPR, HIPAA), robust data governance and security are no longer optional but critical. Sigma’s architecture, where data resides within the governed cloud data warehouse, inherently simplifies compliance and reduces the attack surface compared to systems that create multiple data copies. Native version control, query history, and audit logging are not just convenience features; they are fundamental elements for maintaining data integrity, enabling rapid troubleshooting, and providing irrefutable evidence for regulatory audits. This integrated approach to governance and security offers a higher level of trust and control, paramount for enterprises handling sensitive or regulated data and those operating in complex, evolving data environments.
Sigma’s innovative approach has translated into significant, quantifiable successes for its diverse customer base, demonstrating tangible benefits across various industries.
While features are important, business leaders ultimately seek tangible Return on Investment (ROI) and improved business outcomes. The provided customer success stories move beyond theoretical capabilities to concrete, real-world results. These examples (DoorDash’s cost control, Zumper’s productivity gains, RightRev’s accelerated implementation) serve as powerful evidence that Sigma not only delivers advanced features but also provides measurable financial and operational benefits. They validate Sigma’s claims and provide a compelling narrative for potential adopters, demonstrating how the platform can directly contribute to efficiency, cost savings, and a faster time-to-value.
Sigma Computing stands out as a “Next Gen BI” platform, explicitly designed to transcend the limitations of previous BI generations. It moves beyond “Gen 1” tools that focused on static reports and metrics, and beyond “Gen 2” tools that centered on dashboards and ad-hoc exploration.
Sigma offers the best capabilities of both preceding BI modes—providing secure, accessible, and high-performing dashboards, reports, and visualizations—while fundamentally introducing new outcomes through its unique Data Apps, native write-back functionality, and transparent agentic AI. Its inherently cloud-native foundation ensures that Sigma fully inherits the speed, scale, and robust security of modern cloud data warehouses, free from the “on-premises architectural baggage” that often slows down older, retrofitted platforms. This redefinition of BI empowers every individual within an organization, from seasoned data analysts to everyday business users, to confidently explore, create, and act on data, fostering a truly data-driven culture.
Sigma Computing isn’t just another BI tool; it’s actively redefining the analytics landscape by offering a truly cloud-native, live-data platform that prioritizes unparalleled user accessibility, real-time collaboration, and actionable insights.
By seamlessly bridging the gap between technical data teams and business users with its intuitive spreadsheet interface and unique native write-back capabilities, Sigma transforms data from a static report into a dynamic, operational tool for immediate action and continuous improvement.
While Microsoft Power BI and Tableau remain strong and capable contenders in the BI space, Sigma’s fundamental architectural advantages, unwavering focus on user empowerment, and innovative features like agentic AI (that “shows its work”) and powerful Data Apps position it as a compelling choice for organizations looking to accelerate their data-driven journey and unlock the full potential of their cloud data in today’s rapidly evolving, digital economy.
Everyone’s talking about it:
But do we actually know:
What is cryptocurrency? What is blockchain? Are they the same thing?
How is money created here? Who even invented this concept?
Let’s understand everything in one go — from scratch, and in a way that even a non-tech person would get.
Imagine Blockchain as a digital ledger —
And Cryptocurrency as the money recorded in that ledger.
| Blockchain | Cryptocurrency |
|---|---|
| A technology/platform | A digital currency built on it |
| Like a ledger | Like the value recorded in it |
| Transparent and tamper-proof | Medium of digital exchange |
| Example: Bitcoin Blockchain | Example: Bitcoin, Ethereum |
Without blockchain, cryptocurrency wouldn’t exist.
But blockchain has uses far beyond crypto — such as in voting, land records, and supply chains.
Imagine a register where everyone is allowed to write —
But no one can erase anything, and everyone gets a copy of every change.
That’s essentially blockchain.
Think of a farmer writing each harvest in a notebook and never tearing pages out. That’s how transactions are recorded in blockchain — permanent and secure.
Cryptocurrency is a digital currency that works on a blockchain platform.
No paper, no coins — just a digital token whose value is accepted by consensus.
Here’s where it gets interesting.
Cryptocurrency isn’t printed — it’s mined, like gold or coal.
Here’s how:
For example, Bitcoin miners solve a puzzle and get rewarded in Bitcoins — that’s how new Bitcoins are introduced.
Mining involves:
In 2008, an unknown entity named Satoshi Nakamoto introduced the concept.
No one knows whether Satoshi is a person, a group, or something else.
But they gave the world:
✅ Bitcoin
✅ The concept of blockchain
✅ Peer-to-peer transactions without middlemen
Satoshi’s core idea was:
“Why trust banks that caused financial crashes? Let’s trust math and open code.”
Let’s compare this new digital money with something familiar — UPI.
| Feature | UPI / Bank Transfer | Bitcoin / Cryptocurrency |
|---|---|---|
| Controlled By | RBI / Banks | No central authority |
| Fees | Low | Varies (often higher) |
| Speed | Real-time (in India) | Minutes to hours |
| Control | Bank controls your money | You control via private key |
| Reversible? | Sometimes | No – irreversible once sent |
✅ Blockchain is being used in elections, land records, healthcare, and education
✅ Cryptocurrency has become an investment alternative
✅ Metaverse, NFTs, and Web3 — all are powered by blockchain foundations
Land ownership disputes are among the most common and critical legal issues in India.
Common challenges include:
In many cases, two people claim ownership of the same land — because documents can be manipulated, and there’s no way to verify the real owner.
The Government of Andhra Pradesh launched a pilot project to migrate land records to a blockchain-based system.
Here’s how they tackled the issue:
Blockchain isn’t just for techies or crypto investors.
It’s solving real-world challenges where data integrity, transparency, and public trust are essential.
Blockchain is the engine. Cryptocurrency is the car.
Both are futuristic — but they demand understanding and caution.
Don’t just dive into trends.
Learn. Understand. Think. And then participate.
Have you ever invested in crypto?
Does the idea of blockchain make more sense now?
Seen any real-life applications of it around you?
👇 Drop your thoughts in the comments —
Let’s build knowledge together and make tech more accessible, one concept at a time.
What exactly is Data Mining?
Imagine having a massive field full of data – messy, raw, and unorganized. Now, from that field, you want to extract the juiciest fruits — meaningful patterns, hidden knowledge, and valuable insights.
That process of digging deep into data to find useful gems is called Data Mining.
It’s like:
All powered by the silent engine of Data Mining.
| Crop Farming | Data Mining Process |
|---|---|
| Sowing seeds | Collecting raw data |
| Watering, weeding, waiting | Cleaning and processing data |
| Harvesting the crop | Extracting insights and results |
“In both cases, it’s about patience, care, and extracting value — either as crops from land, or insights from information.”
The main aim is to discover patterns, trends, or relationships within huge volumes of data — patterns that are not visible at first glance.
📍 Think of this:
A mobile recharge app notices that users who recharge for ₹199 often come back in 3 months for a ₹399 plan.
So, next time – they pre-suggest ₹399 right away.
That’s data mining in action.
Let’s decode the whole cycle in simple terms:
➤ Amazon:
“People who bought this also bought…”
That’s a mined pattern.
➤ Banks:
“Is this customer likely to default?”
Data tells before disaster hits.
➤ Netflix & YouTube:
“You may like this show”
Behind the scenes: data clustering and prediction.
Walmart, one of the largest retail chains in the world, once ran data mining algorithms on their billing and transaction data.
The goal was simple:
“Which products are frequently purchased together?”
(A technique known as Association Rule Mining)
They uncovered a surprising pattern:
“Young fathers who buy diapers in the evening are also likely to buy beer.”
At first, this correlation seemed strange.
But upon deeper investigation, it made sense:
👶 After work, fathers would often stop by to buy diapers for their babies.
🍺 While there, they’d also grab a pack of beer — a small reward or moment of relaxation for themselves.
What did Walmart do with this insight?
They rearranged store shelves, placing beer racks next to the diaper section.
Result?
Beer sales spiked significantly, especially during evening hours.
This wasn’t a random guess or intuition — it was the result of powerful data mining.
Walmart analyzed millions of transactions, discovered a hidden trend, and took business action that directly increased profits.
| Technique | Explained Like a Human |
|---|---|
| Classification | Putting people into labelled buckets (e.g., spam vs not-spam) |
| Clustering | Grouping similar people/data points without labels |
| Association Rule | Detecting combos that go together (e.g., chips & cola) |
| Regression | Predicting future numbers (e.g., next month’s sales) |
Because in a world drowning in data, whoever knows how to extract meaning — wins.
From:
Everyone is turning to data mining — knowingly or unknowingly.
“Data Mining is the modern-day farming – where your seeds are raw data, your water is machine learning, and your harvest is powerful decision-making.”
Whether you’re running a startup or leading a billion-dollar company — if you want growth with clarity, this is one skill you cannot ignore.
Data Mining = Data + Logic + Outcomes
It’s not about just collecting more — it’s about extracting better.
So, how did this journey through the “data fields” feel to you?
Did the concept make sense or did something still feel muddy?
If you felt there was any part that could’ve been clearer, or if a real-life example struck your mind — I’d genuinely love to hear from you.
Drop your thoughts, questions, or even corrections down in the comments 👇
Let’s make tech talk not just readable — but relatable.
And if you’ve got a topic in mind that sounds confusing but worth demystifying — I’m all ears.
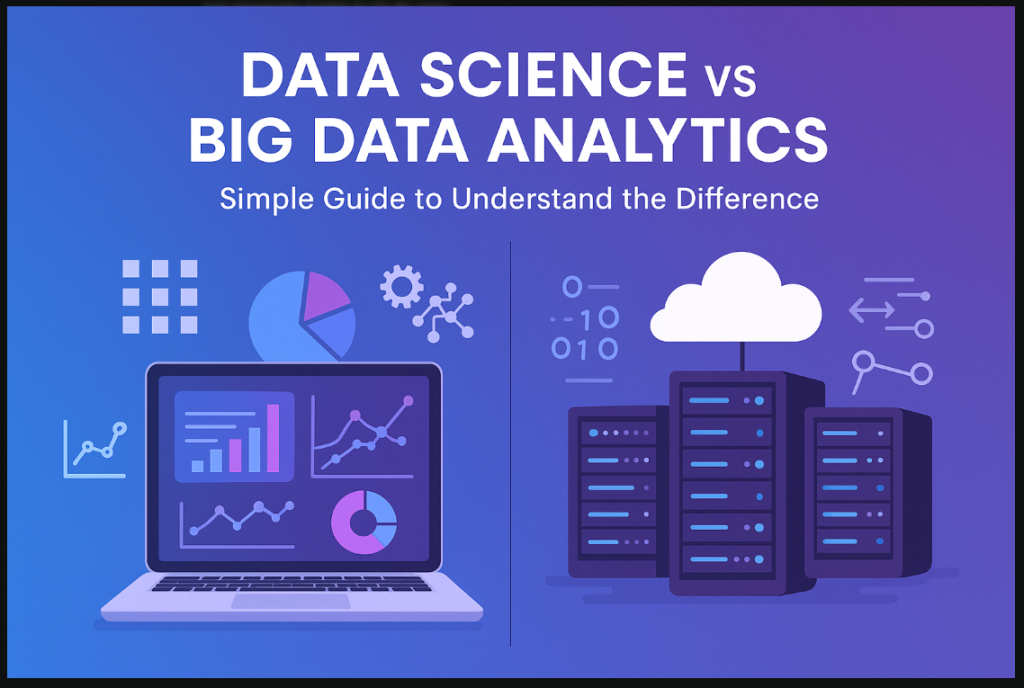
If you’re new to the world of IT or technology, you’ve probably heard of Data Science and Big Data Analytics. But do you really know what the difference between them is? These terms are closely related, but they focus on different aspects of data. Today, let’s break them down from scratch so you can clearly understand how these fields work and why they’re both important.
Data Science is a multidisciplinary field where we analyze data, extract valuable insights, and then turn those insights into actionable decisions. The process involves data cleaning, processing, statistical analysis, machine learning, and data visualization.
When you browse products on Amazon, you often see suggestions like “Customers who bought this also bought” or “You may also like.” These product recommendations are generated through Data Science.
How it Works:
Amazon analyzes the previous behavior of its customers, such as the products you’ve viewed, the ones you’ve purchased, the categories you’re interested in, and so on.
This data is processed using machine learning algorithms, which identify patterns. For example, if you frequently browse tech gadgets, the algorithm will recommend related tech products.
This is a Data Science task, where data needs to be collected, cleaned, analyzed statistically, and machine learning models need to be trained.
Tools Used: Python, R, scikit-learn, TensorFlow, data visualization tools, etc.
Result:
By providing personalized recommendations, Amazon increases user engagement and boosts sales. These insights and predictions come from the work of data scientists.
Big Data Analytics focuses on processing and analyzing vast amounts of data that can’t be handled by traditional data processing tools. “Big Data” refers to data that is huge, complex, and changes rapidly (this is often called the “3 Vs”: Volume, Variety, Velocity).
On platforms like Amazon, another important task is Real-Time Analytics. When a user visits the website, there’s a need for a real-time feedback system that instantly analyzes their actions and optimizes the site accordingly.
How it Works:
Big Data Analytics is used to process huge amounts of data that are continuously generated. For example, in a single second, hundreds of users might visit the Amazon website, view products, add items to their carts, and checkout.
This data needs to be processed in real time to identify trends and patterns immediately. For instance, if a specific product is suddenly in high demand, the system can instantly update the inventory.
This data is big data, which is difficult to manage with traditional systems. Large platforms like Amazon process this data using tools like Hadoop or Apache Spark.
Tools Used: Hadoop, Apache Spark, NoSQL databases (MongoDB, Cassandra), real-time stream processing tools (Kafka, Flume).
Result:
With real-time data processing, Amazon continuously optimizes its website, updates product suggestions, and can handle spikes in traffic.
Through Big Data Analytics, Amazon gains a deeper understanding of its customer behavior, allowing them to adjust marketing and sales strategies on the fly.
Now, let’s take a look at how these two are actually different:
| Aspect | Data Science | Big Data Analytics |
|---|---|---|
| Scope | Data Science aims to solve a specific problem and generate insights for that problem. | Big Data Analytics focuses on processing and analyzing large datasets. |
| Data Size | Data Science typically works with moderately sized datasets. | Big Data Analytics handles large-scale datasets (terabytes, petabytes). |
| Tools & Techniques | Data Science uses machine learning, statistical models, data visualization, and programming languages (like Python, R). | Big Data Analytics uses tools like Hadoop, Spark, and NoSQL databases. |
| Objective | The goal of Data Science is to generate insights and predictions. | Big Data Analytics focuses on efficiently processing huge datasets and identifying valuable patterns or trends. |
| Real-Time Processing | Data Science may require real-time processing, but it’s often optional. | Big Data Analytics often requires real-time processing, especially in applications like social media analysis or financial markets. |
If you’re solving a specific business challenge and your data isn’t huge, Data Science will be your best bet. But if you need to process large-scale data efficiently, Big Data Analytics is essential.
Both fields have their importance and are used in different scenarios. You can choose the one that fits your needs, but often, combining both can be incredibly powerful!
How did this explanation work for you?
In the ever-evolving world of business intelligence (BI), where data accessibility and self-service analytics are no longer luxuries but expectations, Sigma Computing has emerged as a true game-changer. Built natively for the cloud and designed to empower everyone — not just data engineers — Sigma is rapidly becoming a favorite among modern data teams, analysts, and business users alike.

But what makes Sigma Computing stand out in a crowded BI market dominated by tools like Power BI, Tableau, and Looker?
Let’s dive into the key reasons why Sigma is arguably the best BI tool for the modern data stack.
Sigma Computing is natively built for the cloud, meaning it directly connects to modern cloud data platforms like Snowflake, BigQuery, Databricks, and Redshift. Unlike traditional BI tools that require data extracts or caching layers, Sigma pushes queries down to the data warehouse, ensuring:
💡 No more stale dashboards or 12-hour data refresh windows. Sigma gives users a live window into their warehouse — as fresh as your data.
One of Sigma’s most revolutionary features is its spreadsheet-like interface. It feels like Excel or Google Sheets, but instead of pulling and manipulating extracts, users are querying live warehouse data in a secure, governed manner.
This means:
💬 “It’s like Excel on steroids — but safer, faster, and connected to the whole data warehouse.”
Most BI tools force companies to choose between agility and governance. Sigma flips this model by offering both.
With Sigma, you can empower marketing, sales, and finance teams to self-serve without breaking governance policies or compromising security.
Whether you’re a data analyst, an engineer, or a non-technical user, Sigma fits your workflow:
This hybrid low-code/no-code interface brings the entire organization into the analytics workflow — not just the data team.
Sigma is the only BI tool with first-class support for nested and semi-structured data (like JSON, VARIANT in Snowflake). Without needing to flatten or ETL it, you can query this data natively from your warehouse, directly inside Sigma.
This is particularly useful for:
🚫 No complex data modeling. No costly pre-processing. Just query your semi-structured data as-is.
Sigma supports white-labeled embedded dashboards, letting you expose insights to customers, vendors, or partners with full control. Its robust APIs enable developers to integrate Sigma into internal portals, customer apps, or external reports.
Use cases include:
Whether you’re a fast-moving startup or a Fortune 500 enterprise, Sigma scales with your team. It supports:
Sigma also integrates with your modern data stack — dbt, Fivetran, Census, Hightouch, and more — making it a seamless piece in your composable architecture.
Sigma is not just resting on its spreadsheet laurels. The platform is continuously evolving with new features:
And with a strong, growing user community and active customer support, you’re never alone on your analytics journey.
In an era where speed, access, and trust in data are critical, Sigma Computing is leading the next wave of BI innovation. Its familiar interface, live data access, governance features, and no-code flexibility make it a must-have tool for any data-driven organization.
If your team wants to go beyond dashboards and unlock true self-service analytics, it might be time to give Sigma a closer look.
| Feature | Why It Matters |
|---|---|
| Cloud-Native | Real-time data, no ETL |
| Spreadsheet Interface | Fast adoption, minimal training |
| Governed Self-Service | Security + flexibility |
| Support for JSON / Nested Data | Unique capability |
| No-Code + Full-Code Options | Usable by anyone |
| Embedded & API Support | Extend insights outside your org |
| Seamless Modern Stack Integration | Works with dbt, Fivetran, etc. |
| Enterprise-Ready | SSO, RLS, scalable architecture |
Ready to try Sigma?
Explore more at www.sigmacomputing.com or contact your Snowflake/DataOps team to request a demo.