

(Topic: Data Modelling in Power BI – Relationships, Schema, Best Practices)
🧠 Power BI Data Modelling – The Backbone of Smart Reporting
Data modelling in Power BI isn’t just about connecting tables — it’s about designing a structure that enables fast, flexible, and reliable insights.
Think of it as the foundation of your Power BI dashboard. A solid model = faster reports, better visuals, and no calculation headaches.
📐 What is Data Modelling in Power BI?
Data modelling is the process of organizing, structuring, and defining the relationships between your datasets.
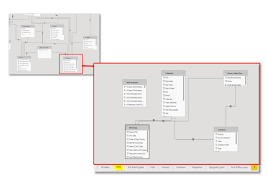
In Power BI, this is done visually in the Model View, where you see tables and their relationships mapped like a flowchart.
🔗 Types of Relationships
Power BI supports 3 key relationship types:
| Type | Example | Description |
|---|---|---|
| One-to-Many | One Customer → Many Orders | Most common, defined via primary key |
| Many-to-One | Reverse of above | Treated the same internally |
| Many-to-Many | Products ↔ Promotions | Avoid if possible; needs careful DAX |
🛑 Power BI does not allow circular relationships.
✅ Each relationship has directionality: it defines how filters flow between tables (important for DAX functions).
🧭 Star Schema vs Snowflake Schema
✔️ Star Schema (Recommended)
- Central fact table (e.g. Sales)
- Surrounding dimension tables (e.g. Product, Customer, Date)
- Simpler, faster performance, ideal for reporting
❌ Snowflake Schema
- Normalized structure (dimension tables split further)
- Can slow performance
- More complex joins
📌 Power BI prefers Star Schema for clean relationships and optimized speed.
🛠️ How to Create Relationships
- Go to Model View
- Drag a field (like CustomerID) from one table to its matching field in another
- Power BI auto-detects:
- Cardinality (One-to-Many, etc.)
- Cross filter direction
- You can edit the relationship properties by double-clicking the line
📅 Common Example: Date Table Relationship
Power BI doesn’t always auto-detect a date table. You should:
- Create or import a Date Table
- Relate it to your fact table (e.g. Sales[OrderDate] → Date[Date])
- Mark it as Date Table in Modeling tab
✅ This enables Time Intelligence functions like YTD, MTD, SAMEPERIODLASTYEAR in DAX.
📉 Avoid These Mistakes
🚫 Using many-to-many without a clear reason
🚫 Circular references between tables
🚫 Keeping unneeded columns (hurts model size & speed)
🚫 Skipping Date Table and relying on auto-generated date hierarchies
🧩 Tips for a Strong Model
✔ Use surrogate keys (integers) for better performance
✔ Set relationships manually if Power BI guesses incorrectly
✔ Rename tables and columns for clarity
✔ Hide columns not needed in reports (right-click > Hide in Report View)
✔ Validate data cardinality before linking tables
✔ Use fact tables for metrics, dimension tables for slicing
🧪 Advanced Modelling Features
- Role Playing Dimensions (e.g. Order Date, Ship Date from same Date Table)
- Calculation Groups (reduce repetitive measures)
- Composite Models (combine Import + DirectQuery)
- Incremental Refresh (for large datasets)
📘 Summary
Data modelling in Power BI is not optional — it’s essential.
A well-designed model:
- Ensures accurate results
- Improves DAX efficiency
- Speeds up visuals and interactions
- Makes your dashboards scalable
Start with a star schema, define your relationships clearly, and clean up unused data. That’s how you master modelling in Power BI.