🛠️ Power Query Tools Tab in Power BI – Diagnose, Debug & Optimize with Confidence
📌 For: TechTown.in
🧑💻 Author: TechTown Team
📅 Updated: June 2025
🔍 Keywords: Power BI Tools Tab, Diagnose Step Power BI, Session Diagnostics, Query Performance Power BI
sample data :
🎯 Introduction
Most users think Power Query in Power BI is just for loading and transforming data. But there’s a hidden gem that takes your skills to the next level — the “Tools” tab.
If your queries are slow, nested steps are causing performance issues, or you want to debug your transformations — the Tools tab is your diagnostic command center.
Let’s explore the Tools tab from your screenshot and understand how to use each option for performance tuning and debugging in Power BI.
🔧 Overview of Tools Tab – What You See
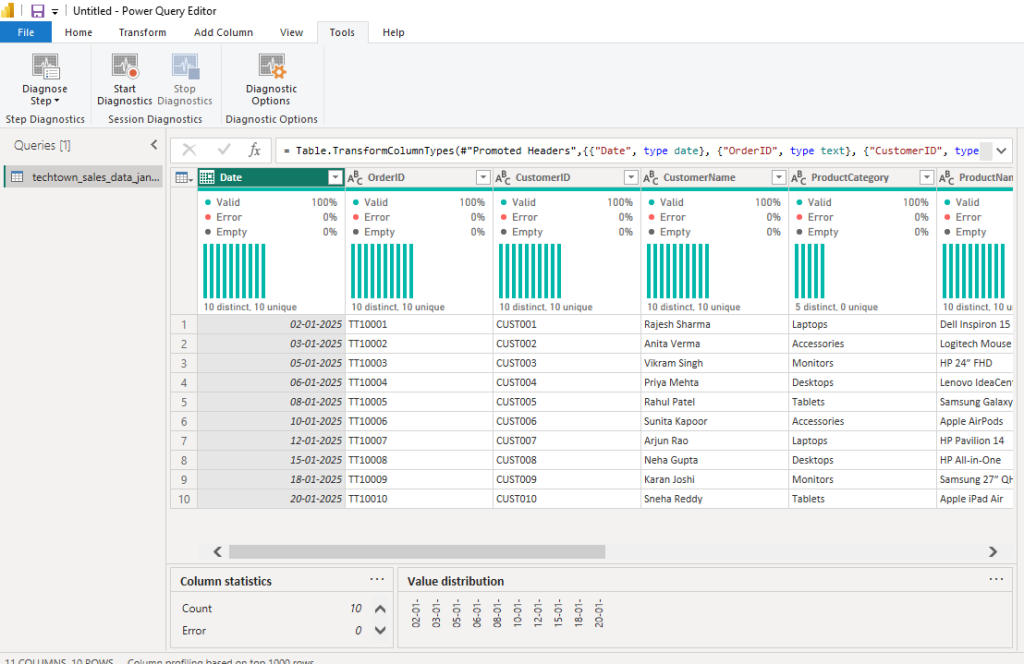
These tools help analyze query steps, monitor performance, and understand bottlenecks in your Power BI report.
🧪 1. Diagnose Step
Diagnose Step allows you to monitor and analyze what happens at a specific transformation step in your query.
📌 Use Case:
You’re applying several filters, merges, or calculated columns. Suddenly, performance drops. Use Diagnose Step to:
- See how long a step takes to execute
- Identify which operation is slowing your query
- Evaluate memory or data load at that point
🧠 How to Use:
- Select a step in Applied Steps
- Click Diagnose Step
- Power BI captures the activity and displays a diagnostics table
▶️ 2. Start Diagnostics
Think of this as a “recording” button for Power Query performance.
It tracks all steps, operations, and queries running in the background.
📌 Example: You click “Start Diagnostics” and then refresh your query. Power BI logs:
- Time taken for each step
- Number of rows read or loaded
- Dependencies and execution flow
You can analyze these logs later to optimize slow queries.
⏹️ 3. Stop Diagnostics
Once the diagnostics session is complete, click Stop Diagnostics.
Power Query generates diagnostic result tables, usually:
- One for detailed step-wise breakdown
- One for summary of queries
📁 These tables appear as new queries in your left panel, so you can analyze them, visualize performance charts, or export.
📌 Tip: Don’t forget to rename them for clarity!
⚙️ 4. Diagnostic Options
This opens a dialog box to customize how diagnostics are recorded.
Options might include:
- Whether to include sub-queries
- Memory profiling (if supported)
- Session-level logging controls
📌 Note: These options may be limited or enhanced depending on your Power BI version and updates.
📊 What Makes These Tools So Valuable?
| Feature | Benefit |
|---|---|
| Diagnose Step | Find bottlenecks in specific steps |
| Start Diagnostics | Track complete query performance |
| Stop Diagnostics | Generate analyzable logs as queries |
| Diagnostic Options | Customize tracking based on needs |
📈 Real-Life Scenario – Techtown Sales Data
Imagine you’re loading techtown_sales_data_jan2025 (like in your image), and you notice the query is slow when refreshing.
Solution:
- Go to Tools → Start Diagnostics
- Refresh the query or apply transformations
- Click Stop Diagnostics
- Review the generated diagnostic queries
You’ll see step-by-step timings, row counts, and data loading patterns.
From there, you can:
- Remove unnecessary columns
- Merge queries more efficiently
- Use filters before expand/merge steps to reduce data load
💡 Pro Tips for Power Users
- Use Diagnose Step when editing complex M code manually
- Avoid putting resource-heavy steps (like joins or group by) early in your query
- Filter data early to reduce load on following steps
- Use diagnostics to decide whether to split large queries into smaller linked queries
✅ Summary
The Tools tab in Power Query isn’t flashy, but it’s crucial for professional-grade Power BI development. If you’re building dashboards for businesses, clients, or even academic projects — understanding what’s happening under the hood is a must.
With just a few clicks, you can:
- Monitor performance
- Debug logic
- Optimize for speed
- Produce audit trails
📚 Further Reading
- 📘 Power BI Official Docs – Diagnostics
- 📥 Download Power BI Desktop
- 📺 TechTown Power BI Tutorial Series – Coming Soon