

➕ Power Query “Add Column” Tab in Power BI – Explained with Examples
📌 Post for: TechTown.in
🧑💻 Author: Team TechTown
📆 Updated: June 2025
🔍 Keywords: Power BI Add Column, Power Query Column From Examples, Index Column, Conditional Column, Power BI data transformation
sample file :
🚀 Introduction
Once your raw data is loaded in Power BI, the real power lies in shaping it the way your business logic demands. The “Add Column” tab in Power Query Editor lets you create custom, intelligent, and automation-friendly columns without affecting your original dataset.
Whether you’re working on customer reports, sales data, or any tabular source — this tab is your formula toolkit.
🧰 What is the “Add Column” Tab?
The “Add Column” tab in Power Query Editor helps you:
- Add logic-based columns
- Generate indexes
- Duplicate or customize columns
- Format text and numbers
- Extract date/time details
- Perform conditional calculations
Every transformation in this tab creates a new column, leaving original data untouched — making it ideal for clean, safe transformations.
🧭 Complete Breakdown of “Add Column” Tab Options
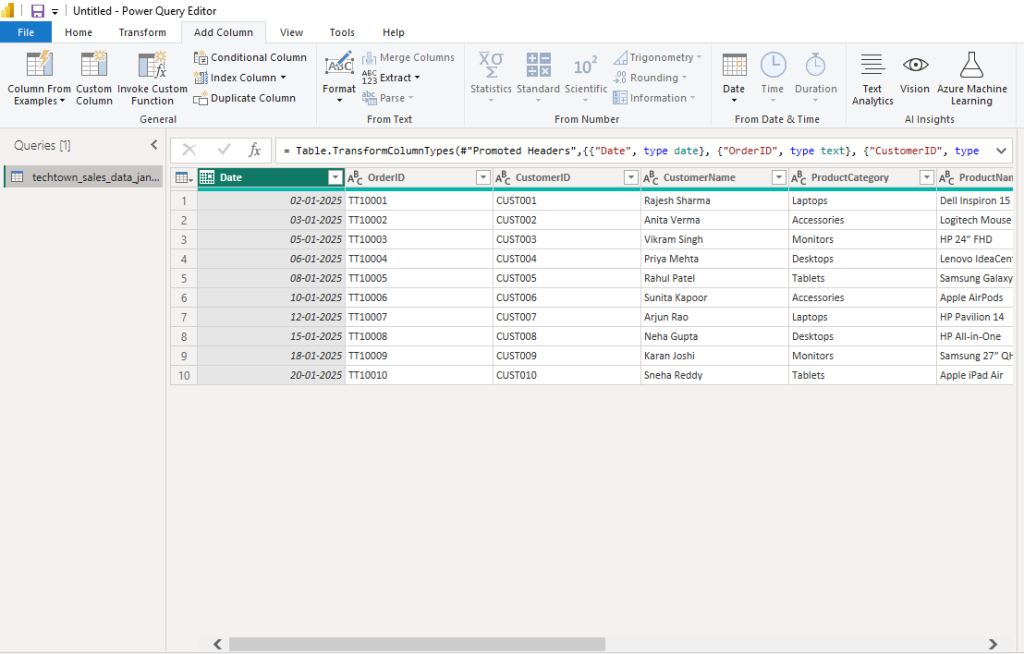
Let’s explore each option shown in your screenshot:
🟩 GENERAL
✅ 1. Column From Examples
One of the most powerful features. It allows you to type sample outputs and Power BI auto-generates the formula.
📌 Example:
You type “HP Laptop” based on “ProductName” and “ProductCategory” — it builds a logic for it!
- Select the source column(s)
- Click Column from Examples → From Selection or From All Columns
- Type the result you expect
- Power BI auto-fills the rest
✅ 2. Custom Column
Allows you to write formulas using M language.
🧠 Syntax example:
= if [ProductCategory] = "Laptops" then "Tech" else "Other"
- Add new logic-driven columns
- Supports
if-else,math,text,datefunctions - Errors are highlighted in real time
✅ 3. Invoke Custom Function
If you’ve created a custom function (like a reusable code block), use this to apply it to a column.
Useful for:
- Repetitive tasks
- Advanced data transformations (e.g., text cleansing)
✅ 4. Index Column
Adds a new column with sequential numbering. Helps in:
- Creating unique IDs
- Row-level tracking
- Sorting logic
Options:
- From 0 (default)
- From 1
- Custom (define start and increment)
✅ 5. Duplicate Column
Creates a copy of the selected column. Use it when:
- You want to apply transformations without losing the original
- You’re experimenting with format or logic
🔤 FORMAT (From Text)
✅ 6. Format
Applies text formatting.
Options include:
- UPPERCASE
- lowercase
- Capitalize Each Word
- Trim spaces
- Clean (removes invisible characters)
Example: “ anita verma ” → “Anita Verma”
✅ 7. Extract
Extract substrings from text based on:
- First N characters
- Last N characters
- Text before/after delimiter
📌 Use case: Extract brand name from ProductName
🔢 FROM NUMBER
✅ 8. Statistics
Performs column-wide statistical operations like:
- Minimum
- Maximum
- Average
- Median
- Count
- Standard deviation
📈 Useful for data profiling or flagging outliers.
✅ 9. Standard
Basic math operations:
- Add/Subtract/Multiply/Divide
- Percentages
- Modulus (remainder)
📌 Example: Add 10% tax to a price column
✅ 10. Scientific
Advanced math tools like:
- Power
- Log
- Exponentials
Useful for scientific or financial datasets.
✅ 11. Trigonometry
Offers:
- Sin, Cos, Tan
- Inverse trig functions
🎓 Rarely used unless you’re analyzing angle-based or GPS-based data.
✅ 12. Rounding
Round numbers using:
- Round up/down
- Round to nearest
- Round away from zero
🧮 Ideal for billing, pricing, or formatted dashboards.
✅ 13. Information
Returns info about a number, like:
- Is even/odd
- Is null
- Is zero
- Is error
📌 Example: Tag rows with missing values or divide-by-zero issues.
📅 FROM DATE & TIME
✅ 14. Date
Extract parts of date fields:
- Year, Month, Day
- Quarter
- Start/End of month/week/year
📌 Example: Create a “Year” column from an order date
✅ 15. Time
Extract time components:
- Hour
- Minute
- Second
- AM/PM
Great for hourly traffic or event logs.
✅ 16. Duration
Calculate time differences between two date/time columns.
📌 Example: Duration between OrderDate and DeliveryDate in days/hours.
🤖 AI INSIGHTS
✅ 17. Text Analytics / Vision / Azure ML
These AI features appear when:
- You’re signed in to Power BI
- Connected to Microsoft Azure
Examples:
- Sentiment analysis from feedback
- Image tagging
- ML predictions
🔗 Requires Azure service connection + permissions
🎓 Real-Life Example from Screenshot
Using your sample dataset (techtown_sales_data_jan2025), here’s what we could do:
| Action | Tool | Result |
|---|---|---|
| Add row numbers | Index Column | 1, 2, 3… |
| Tag products as “Tech” or “Accessory” | Custom Column | Based on ProductCategory |
| Create new column: “CustomerCode_Name” | Column from Examples | “CUST001_Rajesh” |
Extract brand from ProductName | Extract → Before Delimiter | “Dell”, “HP”, “Apple” |
🧠 Why “Add Column” is Best Practice
Unlike the “Transform” tab, Add Column never destroys source data. It:
- Keeps audit trail intact
- Makes Power BI models safer
- Lets you A/B test data logic
- Keeps reports flexible for future updates
✅ Final Thoughts
The “Add Column” tab in Power BI Power Query is a powerhouse of possibilities. From creating new logic to advanced analytics, this is where you bring custom intelligence into your dataset.
🔧 It’s like giving your raw data a brain 🧠 — one column at a time.