

🧰 Power Query Editor Overview in Power BI – A Beginner’s Guide
📅 Updated: June 2025
✍️ By TechTown.in
🔍 Keywords: Power Query Editor, Power BI, Data Transformation, Data Cleaning, ETL Tool, Business Intelligence, No Code BI
sample file:
🔰 What is Power Query Editor?
Power Query Editor is the heart of data preparation in Power BI. It allows users to connect, clean, reshape, and transform data before it’s loaded into reports and dashboards.
Whether you’re working with Excel, CSV, SQL databases, or web data — Power Query makes it possible to turn raw, messy data into clean, analysis-ready tables — without writing code.
🧠 Think of it as Excel’s Power Tools + Automation for Business Intelligence.
🧩 Why Use Power Query Editor?
Most real-world datasets are:
- Inconsistent
- Contain missing or duplicate values
- Have incorrect data types
- Require combining multiple sources
With Power Query Editor, you can:
- ✅ Filter, clean, and correct data
- ✅ Merge multiple sources
- ✅ Apply logic (if/else, conditions)
- ✅ Profile column quality
- ✅ Automate transformations
And once set up, Power Query remembers all your steps — perfect for recurring reports.
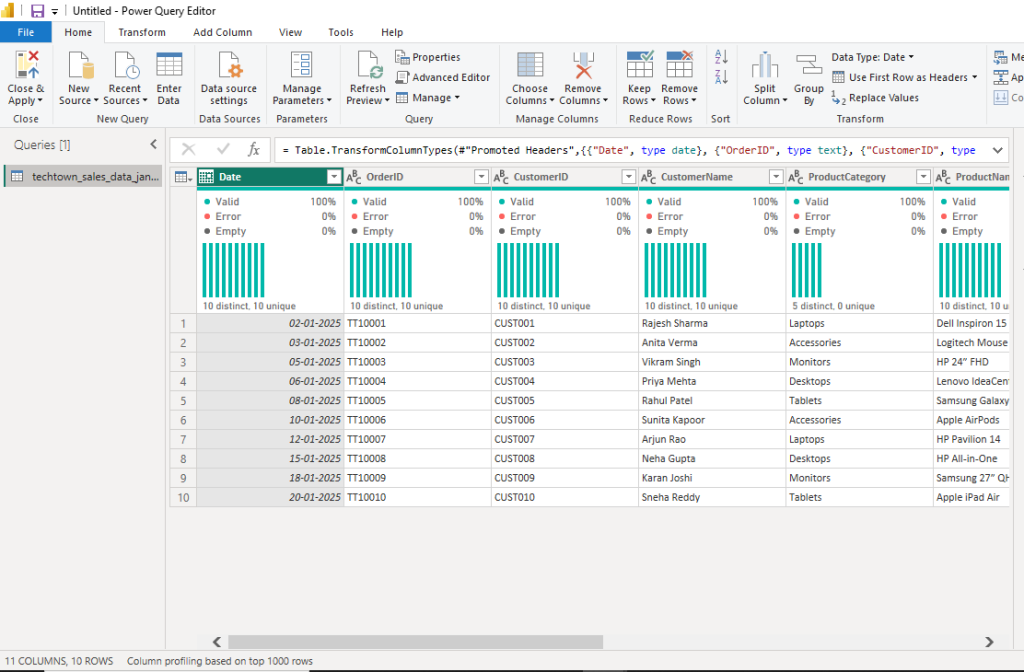
🔷 1. Queries Pane (Left Side)
Displays a list of all queries in the current project.
📌 In your case:techtown_sales_data_jan2025 is the active query.
👉 You can create multiple queries, reference or merge them, and rename them here.
🔷 2. Data Grid (Center)
This shows a preview of your dataset (not the full data yet).
Each column has:
- Header
- Data Type Icon (e.g., ABC = Text, Calendar = Date)
- Filters
- Quality Indicators (Valid, Error, Empty)
- Distribution & Uniqueness
💡 Example from your image:
Date,OrderID,CustomerID, etc. are displayed with quality profiling- 100% valid, 0% error, 0% empty — data looks clean
🔷 3. Formula Bar (Just Above the Table)
Shows the M code (Power Query’s internal language) for each transformation step.
🧠 Advanced users can edit it directly to tweak logic.
📌 Example:
= Table.TransformColumnTypes(...)
🔷 4. Applied Steps Pane (Right Side)
Lists every step you’ve applied to your data, such as:
- Source loaded
- Promoted headers
- Changed types
- Filters, merges, splits, etc.
🛠️ You can:
- Rename a step
- Delete or modify it
- Reorder steps (cautiously)
🔷 5. Ribbon Tabs (Top Menu)
✅ Home Tab
- Connect to data sources
- Close & Apply
- Manage rows/columns
- Change data types, rename, replace, sort, etc.
✅ Transform Tab
- Transpose, pivot/unpivot
- Detect/modify data types
- Text, number, date functions
✅ Add Column Tab
- Create columns using:
- Custom functions
- Examples
- Conditional logic
- Indexing
✅ View Tab
- Toggle on/off: formula bar, column profile, column quality, distribution
- Use “Query Dependencies” to view relationships
✅ Tools Tab
- Diagnose performance
- Record query execution times
- Manage diagnostics settings
🛠️ Common Use Cases for Power Query
| Task | Power Query Feature |
|---|---|
| Removing duplicates | Remove Rows → Remove Duplicates |
| Splitting names/emails | Split Column by Delimiter |
| Merging Excel sheets | Append Queries |
| Filtering invalid data | Filter Rows → Remove Errors |
| Formatting data types | Transform → Data Type |
| Creating new calculated fields | Add Column → Custom Column |
📊 Example: Sales Data Cleanup
You’re working with techtown_sales_data_jan2025, which includes:
- Date
- Order ID
- Customer details
- Product info
Using Power Query Editor, you can:
- 🧹 Clean empty or duplicate records
- 🧩 Merge with Customer or Product master tables
- 🔤 Format
Datecolumn properly - ➕ Add a column to calculate
MonthorQuarterfromDate - 🔍 Profile column distribution to spot inconsistencies
✅ Advantages of Power Query Editor
- No coding required
- Easy to undo any step
- Built-in data profiling tools
- Supports 70+ data connectors
- Works in Power BI, Excel, and other Microsoft tools
- Fully automatable for refreshes
📁 Supported File & Data Sources
Power Query connects to:
- Excel, CSV, JSON, XML
- SQL Server, MySQL, PostgreSQL
- SharePoint, Azure, Web APIs
- OData, Salesforce, Dynamics 365, and more
🧠 Pro Tips for Beginners
- Always check Column Quality & Data Type before loading
- Use “Keep Rows → Top N” for testing on smaller data subsets
- Use “Group By” to summarize data quickly
- Use “Manage Parameters” for reusable filters (like year, month)
- Learn basic M code to unlock advanced logic
📘 Learn More
- 🔗 Microsoft Docs – Power Query Overview
- 📥 Download Power BI Desktop
- 🎥 Power BI Full Playlist (Coming soon on TechTown YouTube)
🏁 Conclusion
Power Query Editor is more than a data import tool — it’s your data refinery. With its powerful UI, no-code transformations, and profiling features, it empowers even non-technical users to perform ETL (Extract, Transform, Load) tasks like a pro.
If you’re serious about mastering Power BI, your journey starts here — in Power Query Editor.