

In Snowflake, query performance isn’t magic — it’s architecture. Every time you execute a query, Snowflake’s intelligent engine orchestrates dozens of behind-the-scenes processes to optimize cost, minimize latency, and ensure accuracy.
Understanding the Query Execution Flow is essential for every data engineer, architect, or SnowPro Core aspirant, because this is the foundation for tuning performance, diagnosing issues, and mastering how Snowflake actually “thinks.”
Explore here Snowflake query execution flow very deeply.
1️⃣ Introduction
Snowflake’s query engine is designed for speed, scalability, and simplicity. It achieves this through its multi-cluster, shared-data architecture, where compute and storage are fully decoupled.
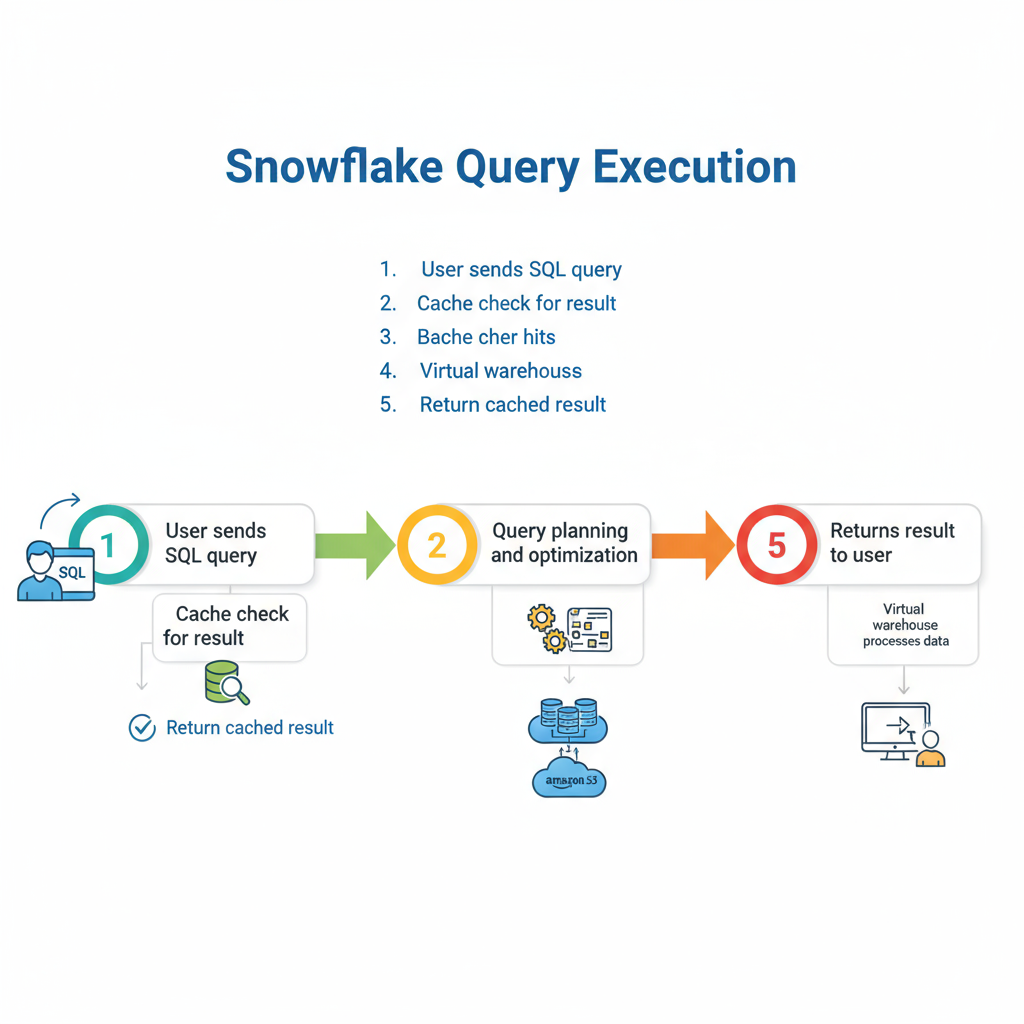
When you run a query, Snowflake doesn’t simply read and execute SQL. Instead, it:
- Parses and validates the query.
- Generates an optimized execution plan using statistics and metadata.
- Executes the plan using virtual warehouses (compute clusters).
- Retrieves only the necessary data from cloud storage.
- Returns results to the user — often faster than you expect.
This flow ensures performance consistency across workloads of any scale — from ad-hoc queries to enterprise-grade transformations.
2️⃣ Snowflake Query Execution Architecture Overview
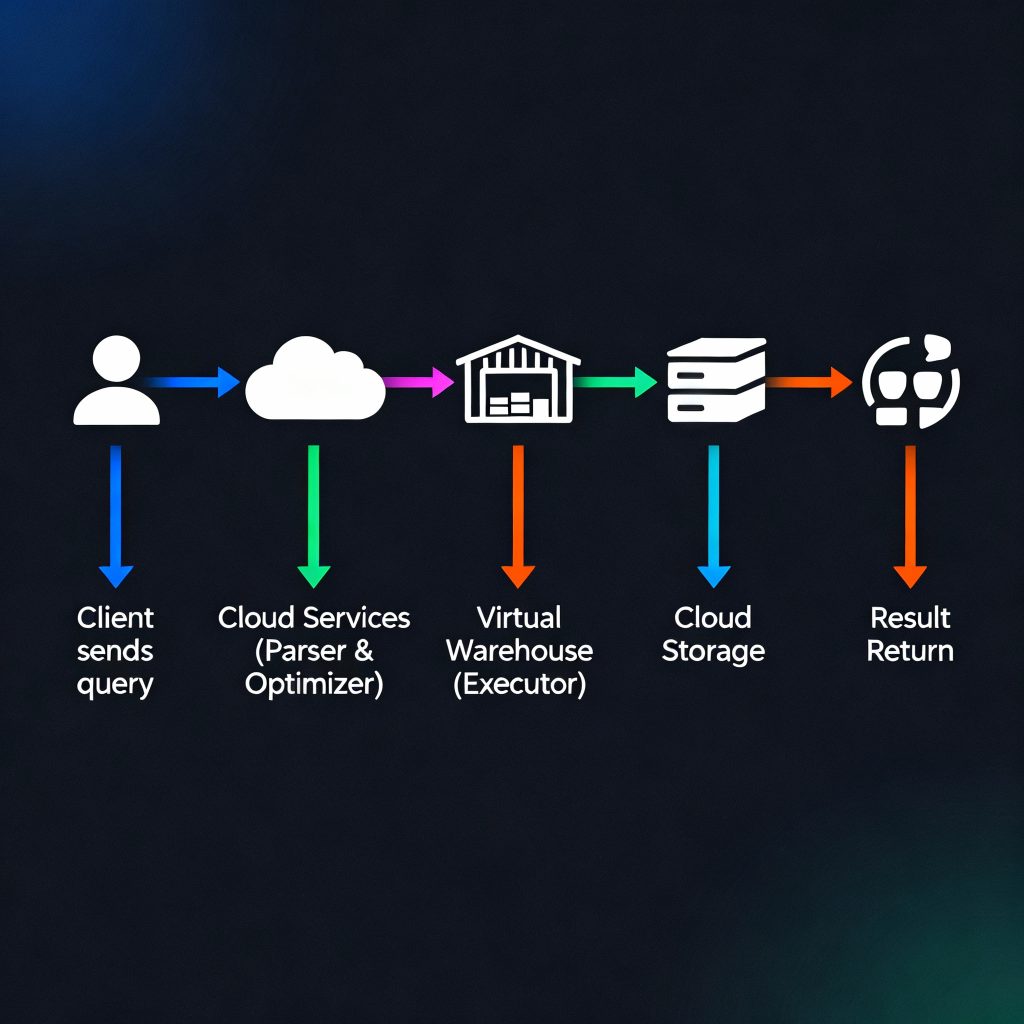
To understand how queries run, you must understand the three-layer architecture that powers Snowflake:
1. Cloud Services Layer
This layer manages query parsing, optimization, and orchestration. It’s the brain of Snowflake.
- Parses SQL syntax.
- Authenticates users and applies role-based access control.
- Generates an optimized execution plan.
- Coordinates between compute (warehouses) and storage.
2. Virtual Warehouse Layer (Compute)
Virtual Warehouses are independent compute clusters responsible for executing the query plan.
- Perform joins, aggregations, and filtering.
- Scale up or out as needed.
- Can process workloads in parallel using multiple clusters (multi-cluster warehouses).
3. Storage Layer
This is where your actual data resides — typically on AWS S3, Azure Blob, or Google Cloud Storage.
- Stores data as compressed, micro-partitioned files.
- Snowflake doesn’t move the data — compute accesses it remotely.
- Metadata about data structure and partitions is stored in the Cloud Services Layer.
Conceptual flow:
Snowflake three-layer architecture conceptual flow
3️⃣ Step-by-Step Query Execution Flow in Snowflake
The query lifecycle in Snowflake is a sequence of well-orchestrated steps.
Step 1: Query Submission
A query is submitted via Snowsight, SnowSQL, or any client connected through JDBC/ODBC or API.
Step 2: Query Parsing
Snowflake parses the SQL to check syntax, validate roles and privileges, and confirm object references (like tables and views).
- Invalid SQL is rejected immediately.
- The parser builds a logical query tree — a structured representation of your SQL logic.
Step 3: Optimization Phase
This is where Snowflake’s cost-based optimizer comes into play. It analyzes:
- Statistics on tables and columns.
- Metadata about micro-partitions and clustering.
- Historical query profiles and cost models.
The optimizer generates an optimal execution plan, minimizing data scans and reducing compute load.
Step 4: Execution Planning
Snowflake’s query planner converts the optimized plan into executable tasks, distributing them across the compute clusters (warehouses).
- Each step in the plan is represented as an operator (e.g., filter, join, aggregate).
- Execution is distributed and parallelized automatically.
Step 5: Data Retrieval from Storage
Virtual warehouses fetch only the relevant micro-partitions from cloud storage.
- Unnecessary partitions are skipped (known as partition pruning).
- Data is read in compressed form and decompressed in memory for processing.
Step 6: Compute Processing
Virtual Warehouses execute the actual data operations:
- Filtering rows, performing joins, aggregations, and calculations.
- Data flows through multiple compute stages (pipelines).
- Intermediate results may be stored temporarily in local warehouse storage.
Step 7: Result Assembly & Return
The processed results are sent back to the Cloud Services Layer, which assembles the final dataset and returns it to the client.
If a similar query is executed later, Snowflake can leverage caching (though that’s covered separately).
4️⃣ Key Components Involved in Query Execution
Each Snowflake query relies on a set of coordinated components:
| Component | Responsibility |
|---|---|
| Cloud Services Layer | Parsing, optimization, metadata management, security |
| Virtual Warehouse | Executes query operations, scaling compute resources |
| Storage Layer | Holds persistent, compressed, micro-partitioned data |
| Metadata & Statistics Engine | Guides optimization, identifies relevant micro-partitions |
| Query Processor | Manages execution plan and intermediate results |
Conceptual Flow Diagram
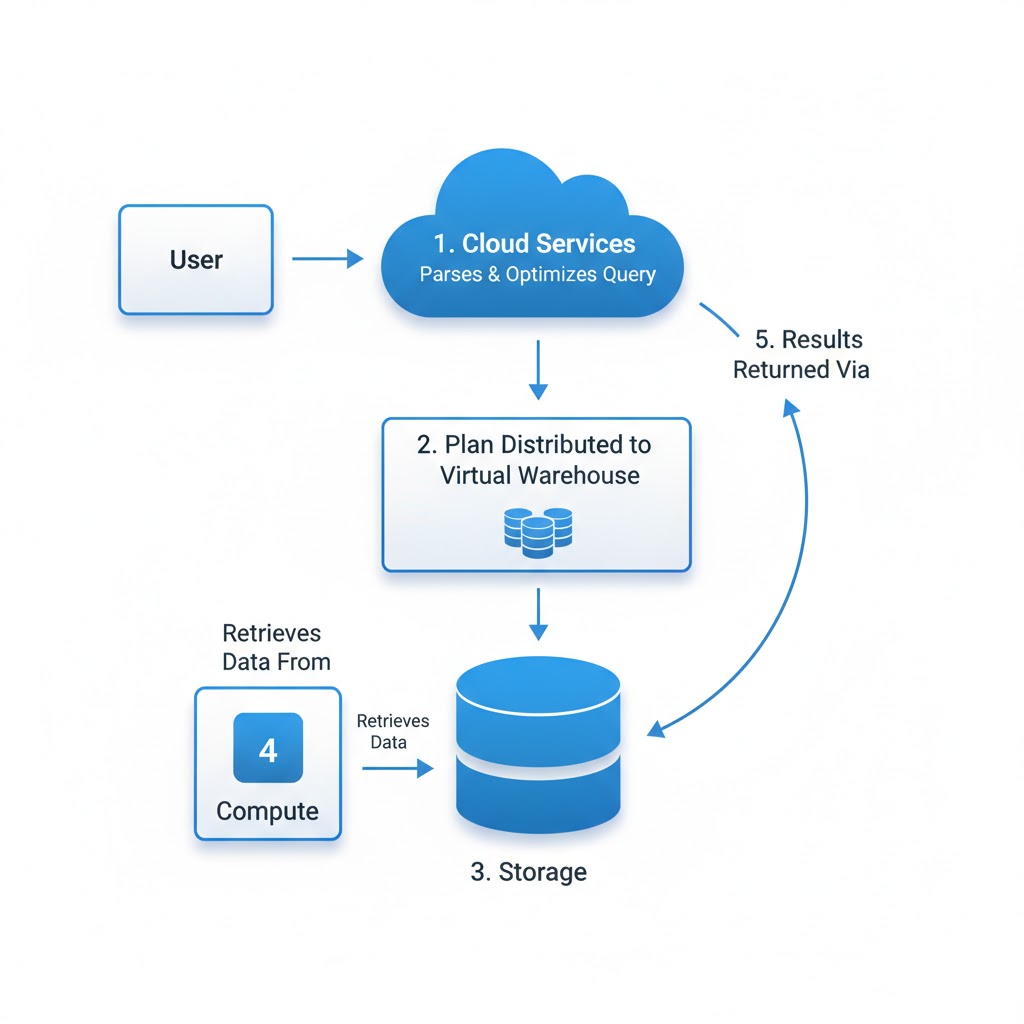
Fig: Query Execution Flow Snowflake
5️⃣ Query Optimization and Execution Strategy
Snowflake’s cost-based optimizer is one of its biggest strengths. Unlike traditional databases, Snowflake automatically chooses the most efficient execution plan using:
- Metadata about table structures and clustering.
- Micro-partition statistics (min/max values).
- Query history and execution costs.
This means developers don’t need to manually hint the optimizer — Snowflake figures out the most efficient path itself.
Query Profiles in Snowsight
You can visualize how a query executed via Query Profile (History → Query Details). It displays:
- Execution time by stage.
- Percentage of time spent in I/O vs compute.
- Amount of data scanned vs returned.
Pro Tip:
Use Query Profile to identify long-running stages, skewed joins, or bottlenecks in data scanning.
Common Mistake:
Believing that increasing warehouse size always speeds up queries — poor query structure or unoptimized joins often cause most delays, not compute limits.
6️⃣ Best Practices for Efficient Query Execution
Snowflake handles a lot automatically — but good design and query habits still matter.
✅ Practical Tips:
- Use selective filters: Narrow down data early to reduce scanned partitions.
- Leverage clustering keys: Especially for large, frequently filtered tables.
- *Avoid SELECT : Retrieve only the columns needed.
- Right-size your warehouse: Use Medium for ETL, Large for BI — scale up only when necessary.
- Separate workloads: Don’t mix ETL and analytics on the same warehouse.
Pro Tip:
Start with query optimization, not warehouse scaling. Efficient SQL and clustering can outperform larger compute in cost and speed.
Common Mistake:
Running all workloads on one always-on warehouse — this leads to compute contention and wasted credits.
7️⃣ Summary & Key Takeaways
- Snowflake’s Query Execution Flow involves parsing, optimization, distributed compute execution, and result delivery.
- The Cloud Services Layer handles orchestration; Virtual Warehouses handle compute; Storage Layer holds data.
- The cost-based optimizer automatically generates efficient plans using metadata and micro-partition stats.
- Understanding the flow helps engineers optimize performance, reduce cost, and prepare for certification.
8️⃣ Resources
Next, explore Caching in Snowflake, which builds on this process by reusing query results for even faster performance.
For deeper study:
- Snowflake Query Processing Overview
- Understanding Query Profile and Optimization
- SnowPro Core Certification Guide
summary: mastering how Snowflake executes queries — from parsing to compute execution — transforms you from a user into a Snowflake performance expert. It’s the first step toward building fast, efficient, and scalable data systems.